The Benchmark feature allows you to compare your policy compliance scores with those of your peers.
Tenacy allows you to compare your public policy compliance scores with those of your peers. This comparison is also possible for policies that have been derived from public policies. (for exemple if you derived ISO 27002 as part of your DA).
This fonctionality allows you to quickly get an idea of your level of compliance compared to other Tenacy clients following a targerting level more or less wide.
Summary
1. How to access the benchmark ?
1.1. Benchmark tab
1.2. Dashboards tab
1.3. Policies tab
2. How does the benchmark work?
3. How to personalize the benchmark ?
3.1. Edit the benchmark
3.3. Edit block settings
1. How to access the benchmark?
You can access the benchmark via 3 ways:
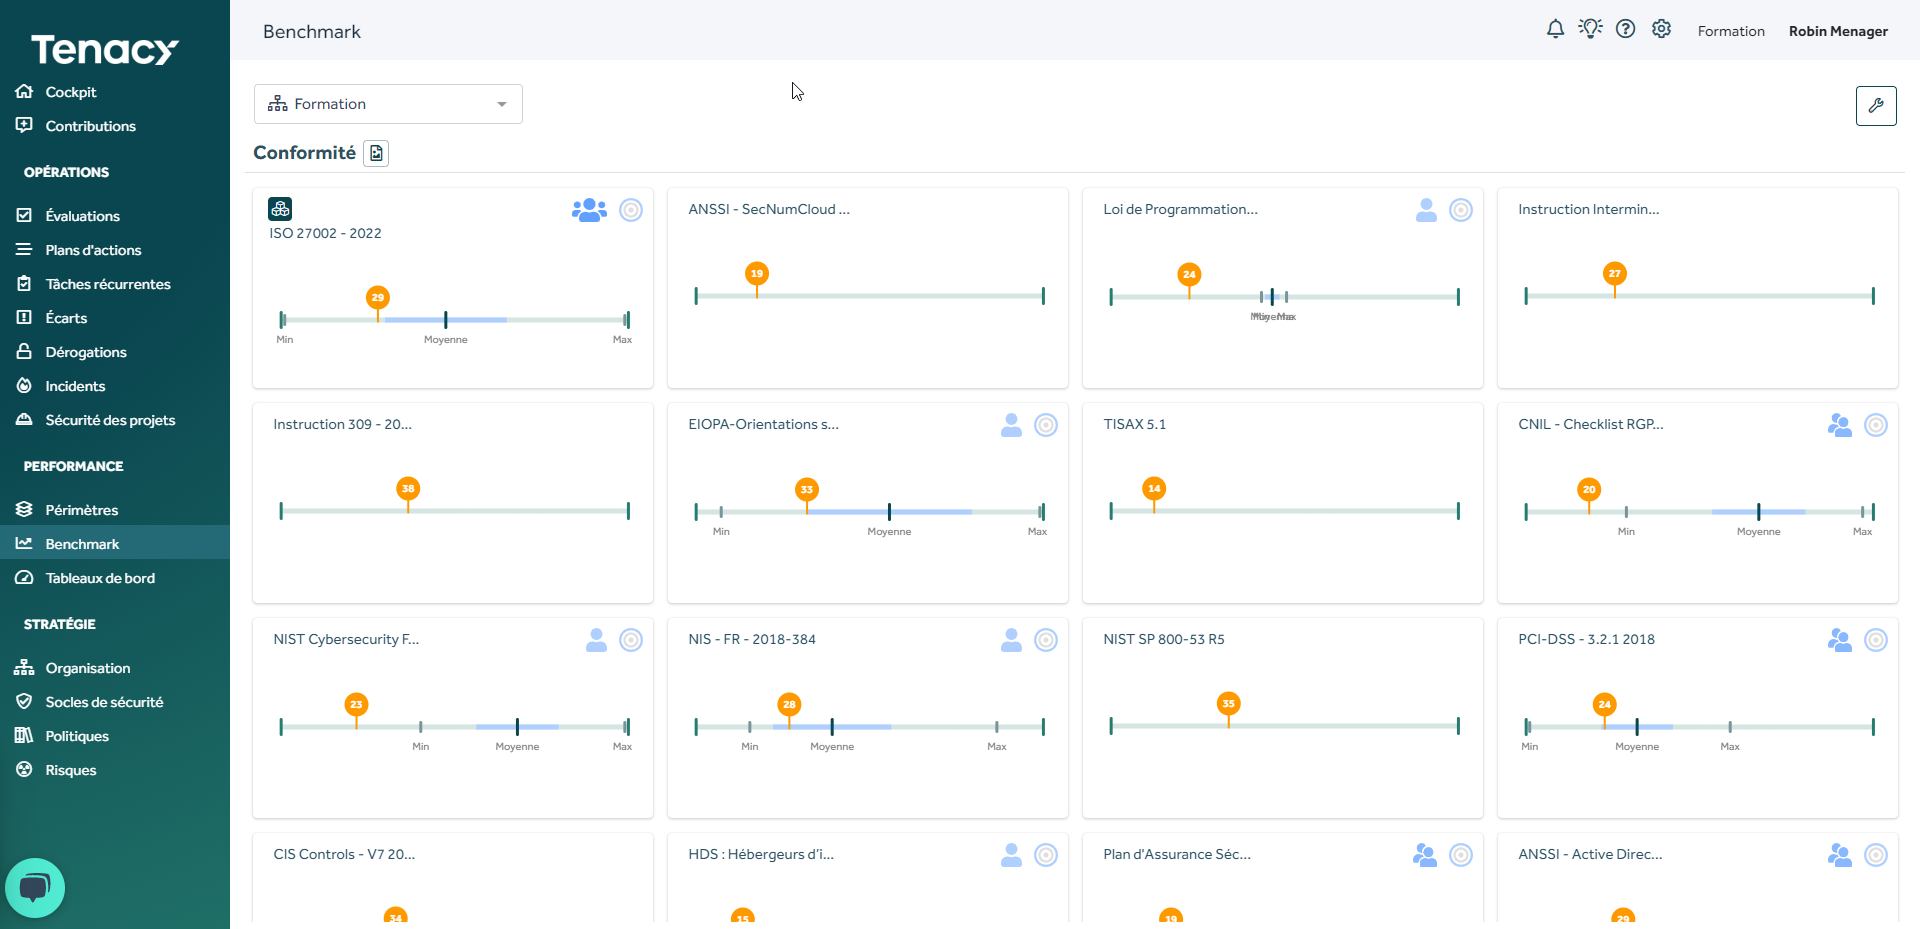
1.1. Benchmark tab
You can access through the lateral navigation bar. It is under the "Performance" category.
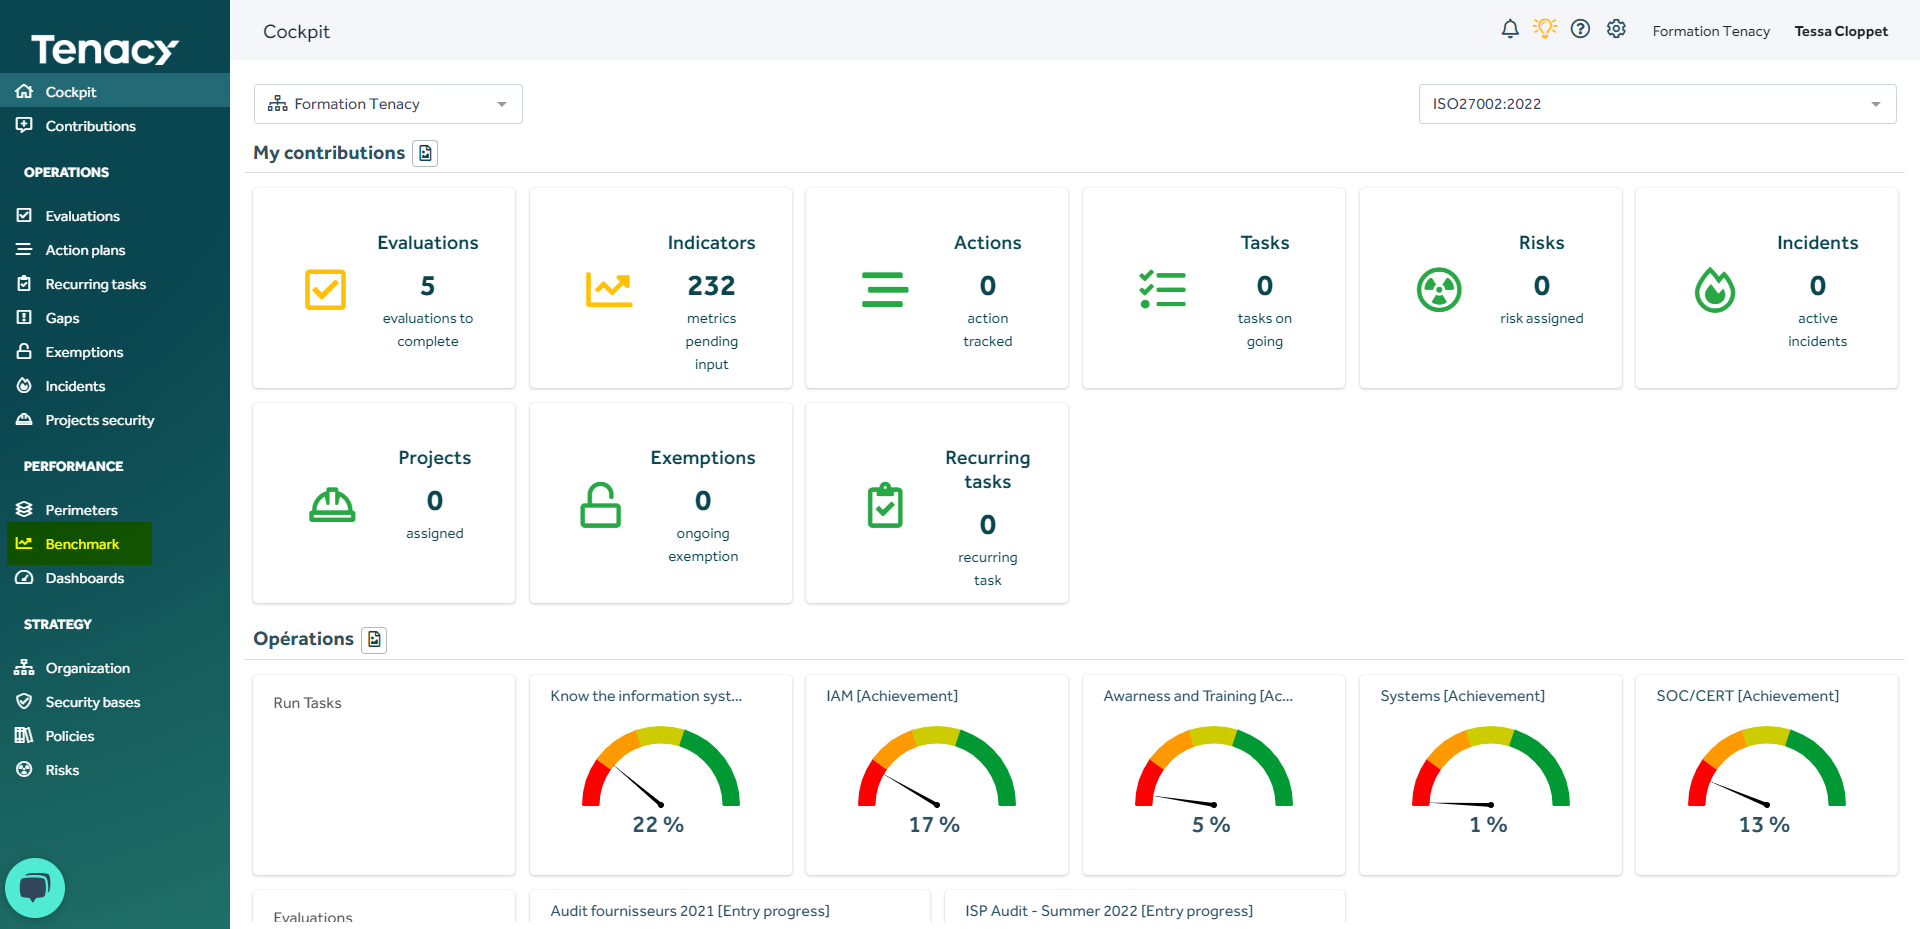
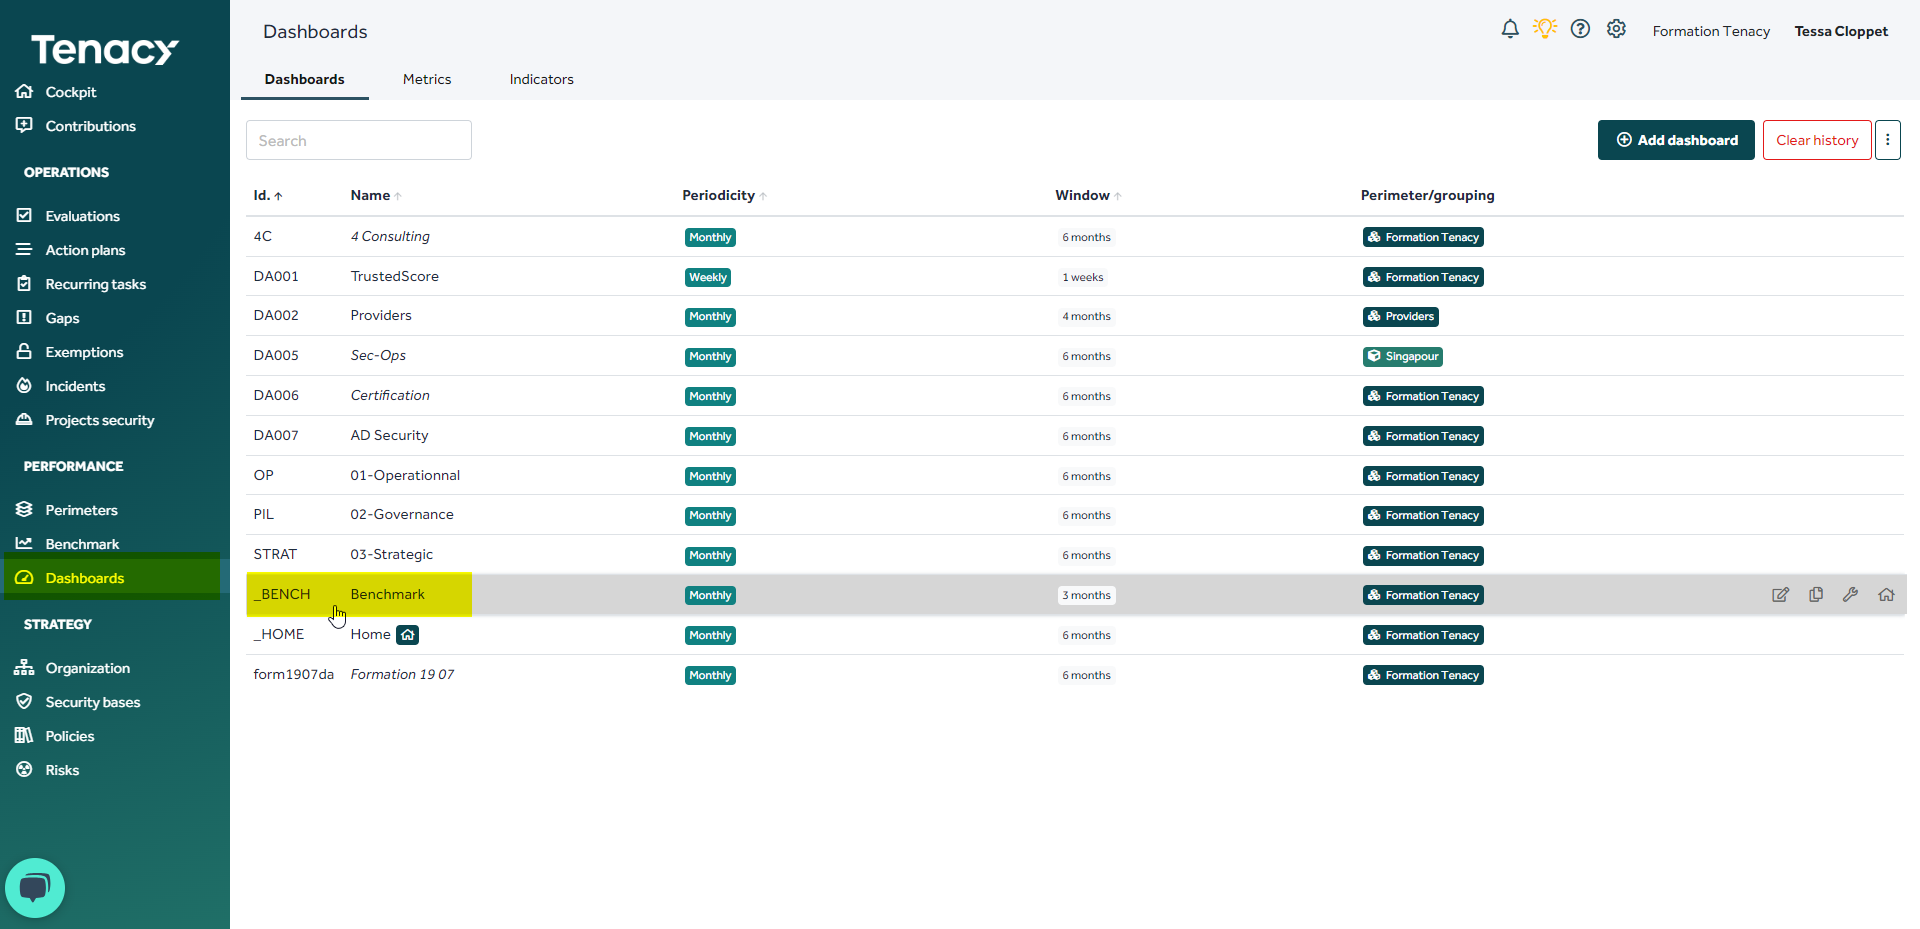
1.2. Dashboard tab
You can access it through the dashboard tab. A Benchmark dashboard (_BENCH) is created by default and automatically updated when you associate new policies to your perimeters or unpair them.
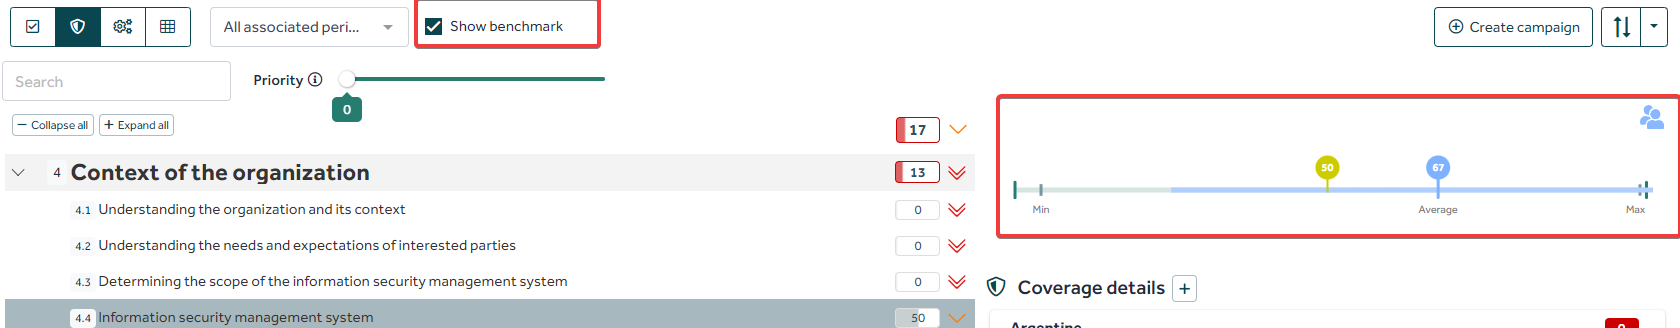
1.3. Policies tab
From the "Policies" tab you have access, for public and derived policies from the Tenacy catalogue, to a detailed benchmark for each measure. Viewing the benchmark via the policy tab thus offers a higher level of granularity.
🔎 In standard, the "Display Benchmark" box is checked. If you uncheck it, the modification is taken into account and when you return to your policy, you won't see the benchmark.
You might want to read the article about the specifics of the benchmark in the Policies tab to learn more.
2. How does the benchmark work?
1.1. Calculation
The benchmark displays your compliance score on a policy (whether private or public) via a so-called "Box plot" representation slightly reworked by Tenacy teams.
🔎As soon as a public policy is paired with one of your perimeters, a block is automatically created in the benchmark.
The compliance scores are used for the representation. A minimum, an average and a maximum are represented. Those ones are calculated compared to the scores of other Tenacy customers according to a level of targeting.
1.2. Targeting
The benchmark targeting level is indicated according to the number of customers and their activity area:
 All activity areas combined
 Activity area
- Public sector, Infrastructure, trade, Production, Services
 Detailed activity areas
- Public administration, Education, Health & Social, Transportation, Energy & public services, Wholesale, Specialized distribution, Hotel and catering, Agriculture & Ressources, Construction, Industry, Pharmaceutical industry, Bank Finance, Insurance & Mutual health, Business service, Consulting, Consumer service, Software editor, Telecommunication, Cyber consulting
 Large sample (more than 10 values)
 Average sample (6 to 10 values)
 Weak sample (3 to 5 values)
3. How to personalize the benchmark?
The benchmark can be personalized both in its visual representation and in the score used.
3.1. Edit the benchmark
Go into "Benchmark" then edit the dashboard:
3.2. Edit general settings
Once editing is enabled, clic on the icone on the top right corner to access benchmark general settings.
You can edit:
- The dashboard name: by default Benchmark
- The timewindow: it has no effect on the benchmark.
- Attachment to a perimeter/perimeter grouping/root tree: by default, the root
- Add/Edit sections: by default "compliance" section
3.3. Edit a block settings
Once editing is enabled, clic on the icone on the top right corner of the block to access its parameters.

- The block name: by default it is the name of the policy
- The type of display: we advise you to not edit this one. The benchmark is mainly based on the graphical representation "Box plot".
- Select an indicator: by default the selected indicator is the coverage score. You absolutely can select an other type of score (declarative, measured). It is possible that the average, the minimum, the maximumand and the standard deviation won't be displayed. This is due to the fact that few clients have created these blocks on these scores.
- Force scope: if you want that the benchmark report only applies on a perimeter/group perimeter/precise root tree.
- Standard deviation: display the standard deviation in the graphical representation.
- Max/min: display the scores maximum/minimum
- Scale: by default the selected scale is "reporting". It isn't necessary to edit it, because it has no impact on the graphic representation.