Connectors report metrics and are linked to indicators, they participate in monitoring the performance of measures.
Summary :
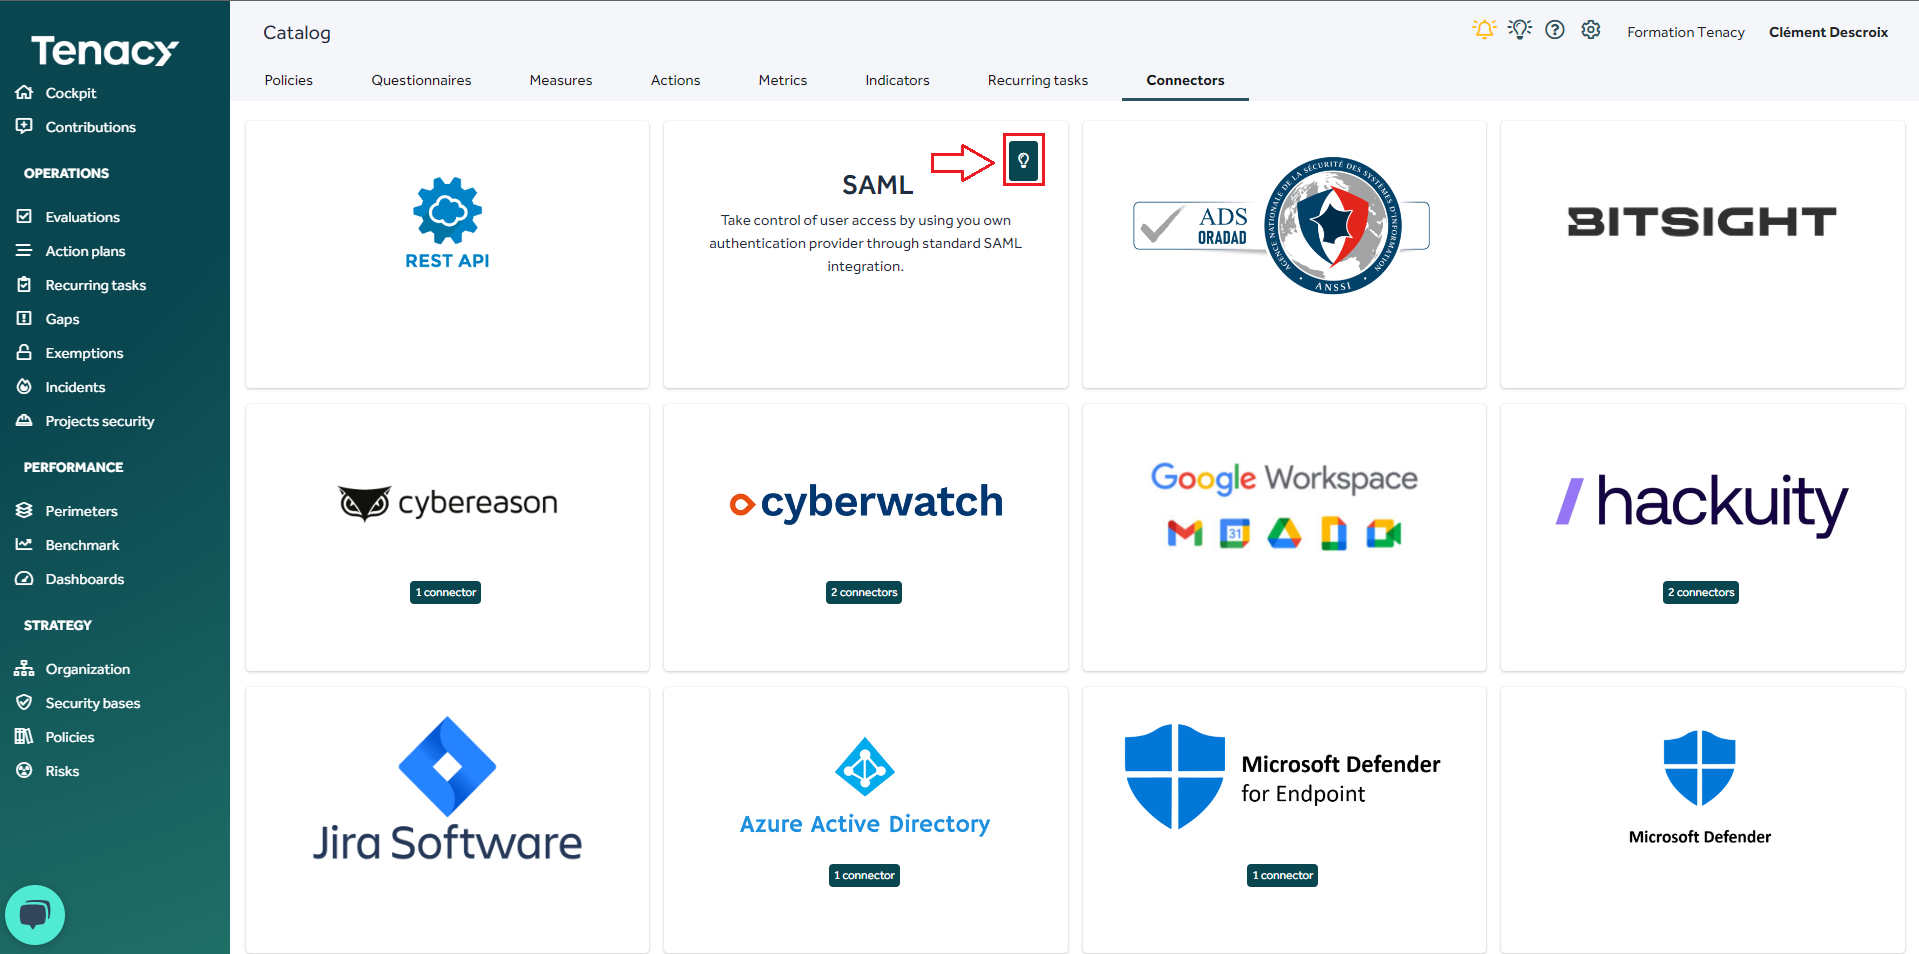
To find connectors listed in the solution you must go to:
Cogwheel ![]() > Catalog > Connectors:
> Catalog > Connectors:
Then you can find information associated with these connectors by clicking on the bulb ![]()
1. Link with measures
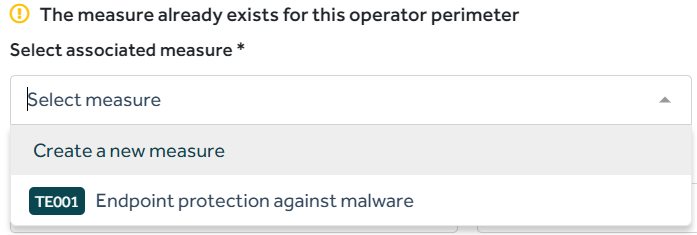
Creating a connector results in creating a new measure or linking the existing measures.
In the following example (see image below), we have TE001 this is a measure already operated on a perimeter in my environment and that I can link to my connector.
🔎For connectors that power multiple measures, you will be asked to activate each measure and configure them independently.
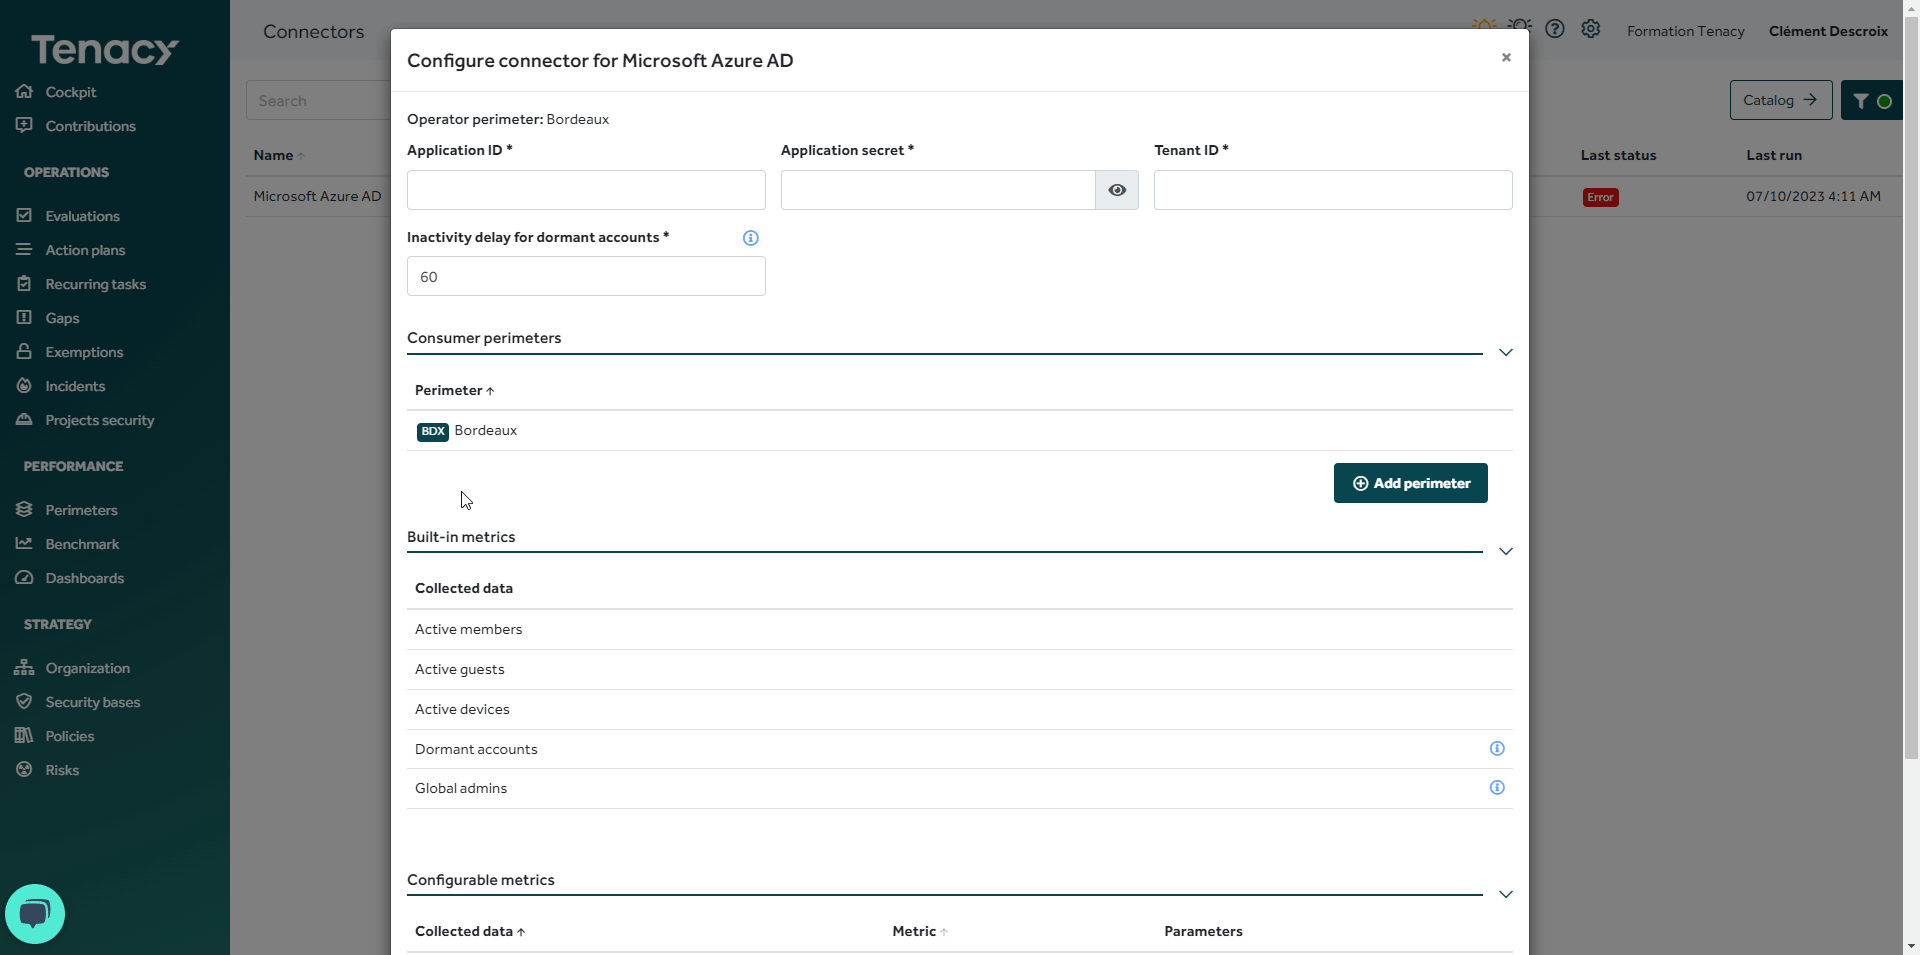
2. Link with perimeters
Measures can be consumed by one or more perimeters.
By default, the operator perimeter (the one chosen when creating the connector) is added as a consumer.
It is possible to remove it and add other consumer perimeters.
3. Link with metrics
When installing connectors, they will collect two types of metrics:
- Built-in metrics, they are said not parameterized and are the result of a link between the data collected in the connector tool (Cyberwatch, Azure, ...) and Tenacy.
- Configurable metrics, are metrics requiring a specific parameter for each measure. It will be possible to collect these metrics several times with different parameters.
Conclusion
These metrics are reported in indicators that help calculate the operational performance of your measure.
🔎 This operational performance is calculated by performing your recurring tasks and reporting your metrics for the calculation of your performance indicators.