Find out what a connector is in Tenacy, how to configure it and how to use it - General Principles
Summary:
- What is a connector in Tenacy
- What data can a connector retrieve?
- Instantiate a connector
- Instantiate connector with module
- Run a connector
- Where can I find the metrics reported by a connector?
- Optional - Configurable metrics
1. What is a connector in Tenacy ?
We have developed connectors that allow you to integrate information from your various tools into a single platform. Indeed, Tenacy enables you to centralize all the security data of your organization in just a few clicks. No more juggling between different interfaces and wasting time collecting and organizing data. Tenacy frees you from tedious tasks, allowing you to focus on analysis and strategic decision-making.
Connect your favorite tools to Tenacy in just a few clicks to centralize your data and act more quickly.
🔎 The use of connectors depends on your license. Feel free to contact us for more information.
💡You can find all available connectors in the ⚙️settings > ![]() catalog > connector tab.
catalog > connector tab.
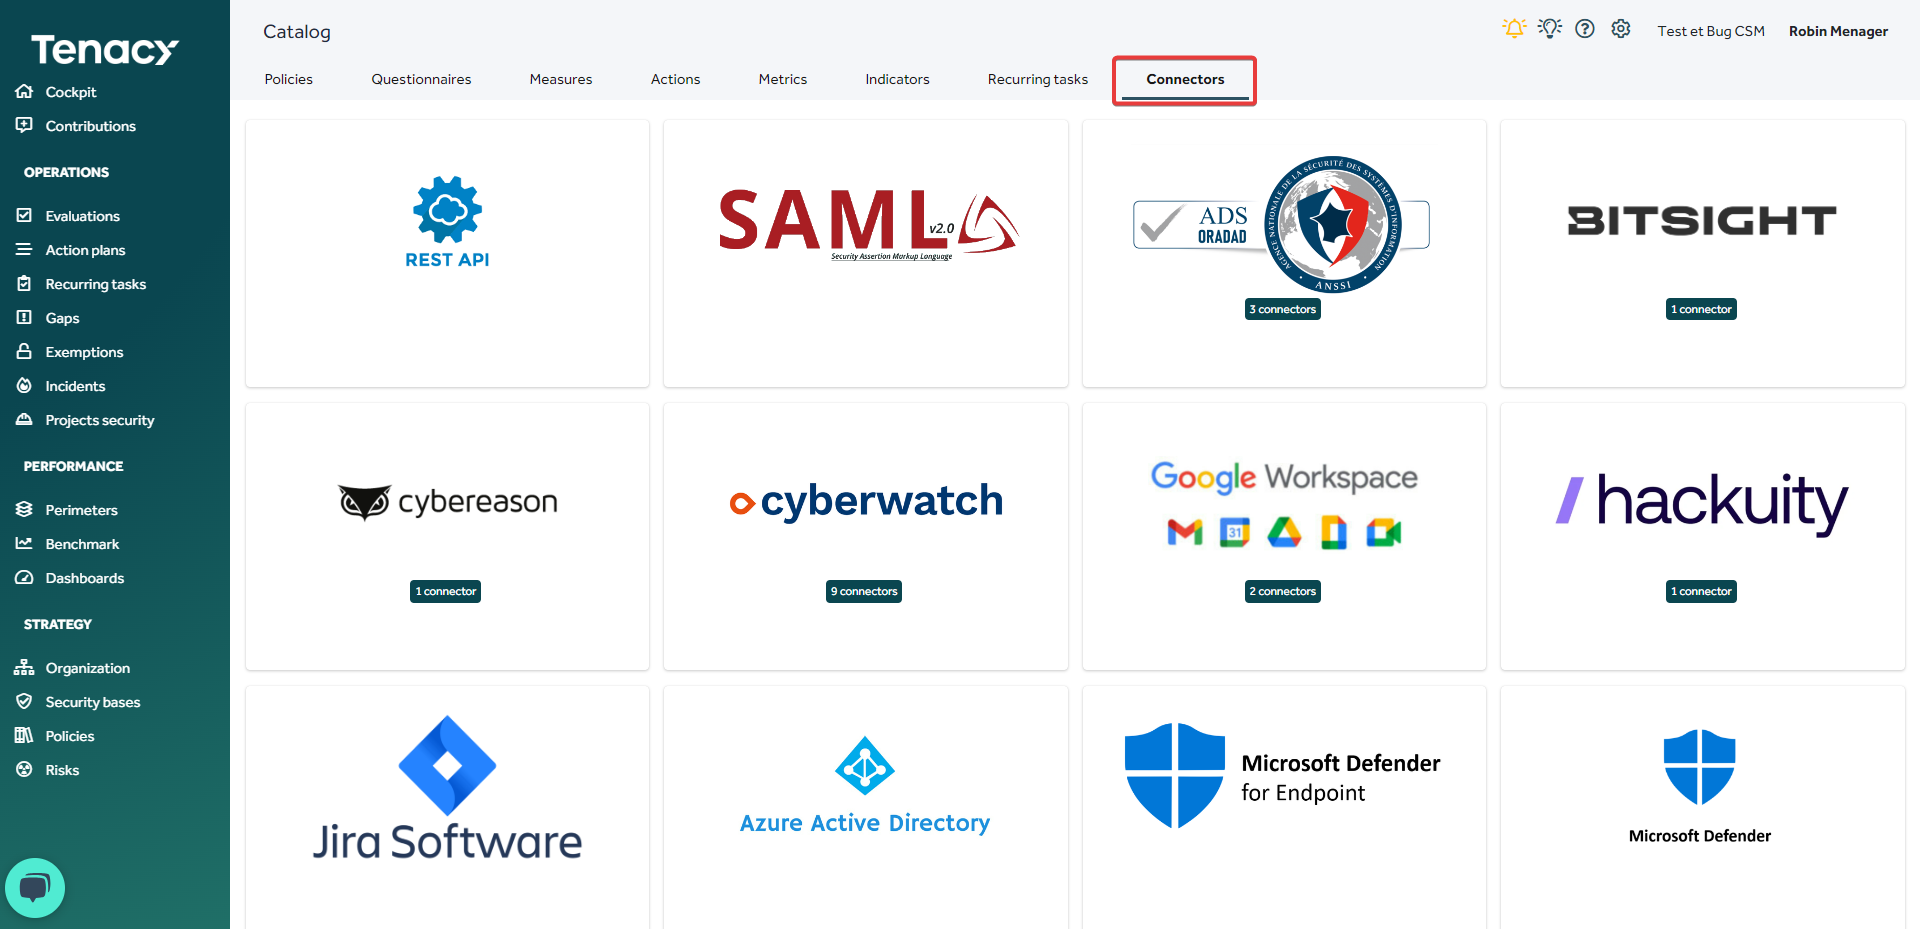
If you would like more information about the desired connector, click on the help bubble.
2. What data can a connector retrieve?
The implementation of connectors aims to automate the creation or updating of objects within Tenacy.
Some connectors are capable of creating and updating recurring tasks, while others can retrieve metrics, and some can highlight vulnerabilities in the form of discrepancies within Tenacy.
🚨When a connector is instantiated, a measure is automatically created and operated within the operator's perimeter.
For example, activating the "ADS - ORADAD" connector automatically operates the "TE 039 Identity Management" measure.
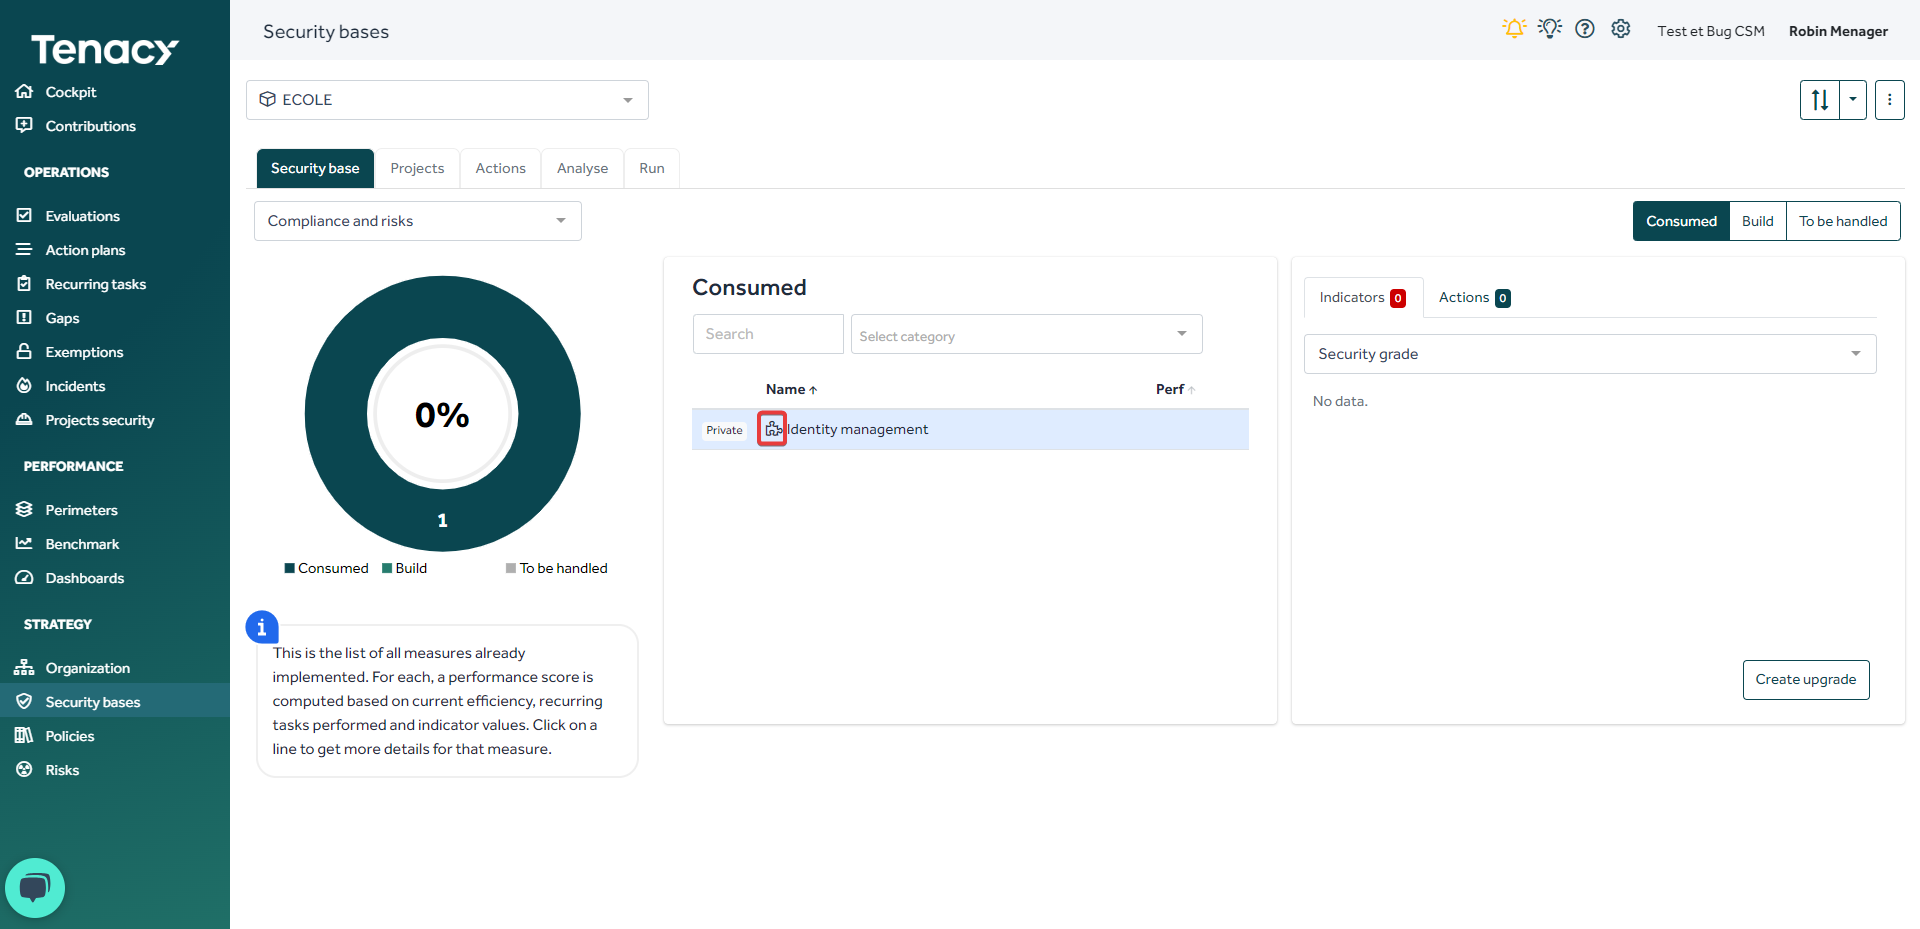
You can easily find the operated measure by going to the " ![]() Security Foundation". The measure powered by a connector will be identified by this icon
Security Foundation". The measure powered by a connector will be identified by this icon ![]() .
.
3. Instantiate a connector
When you choose to instantiate a connector, the solution will ask you to select an operator perimeter.
Furthermore, for connectors that retrieve metrics in Tenacy, you can select a frequency that will apply to the collected metrics.
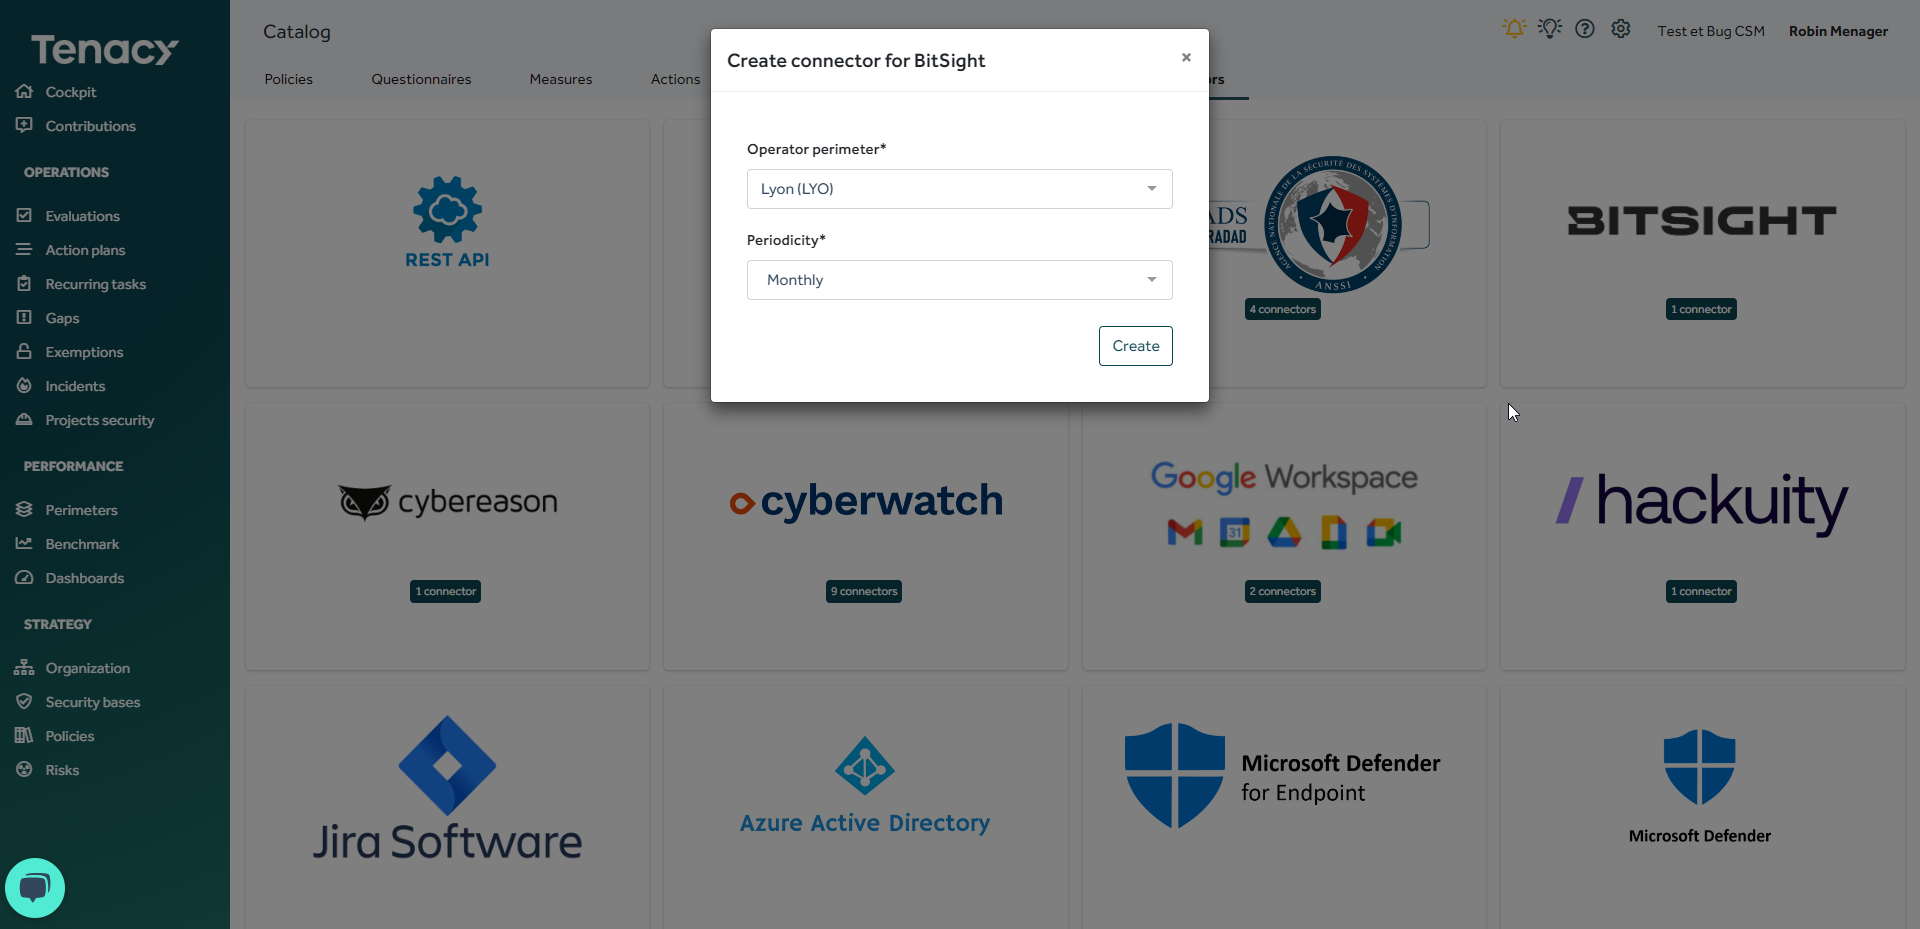
The connector BitSight will be instantiate on the perimeter "Lyon" with a monthly periodicity
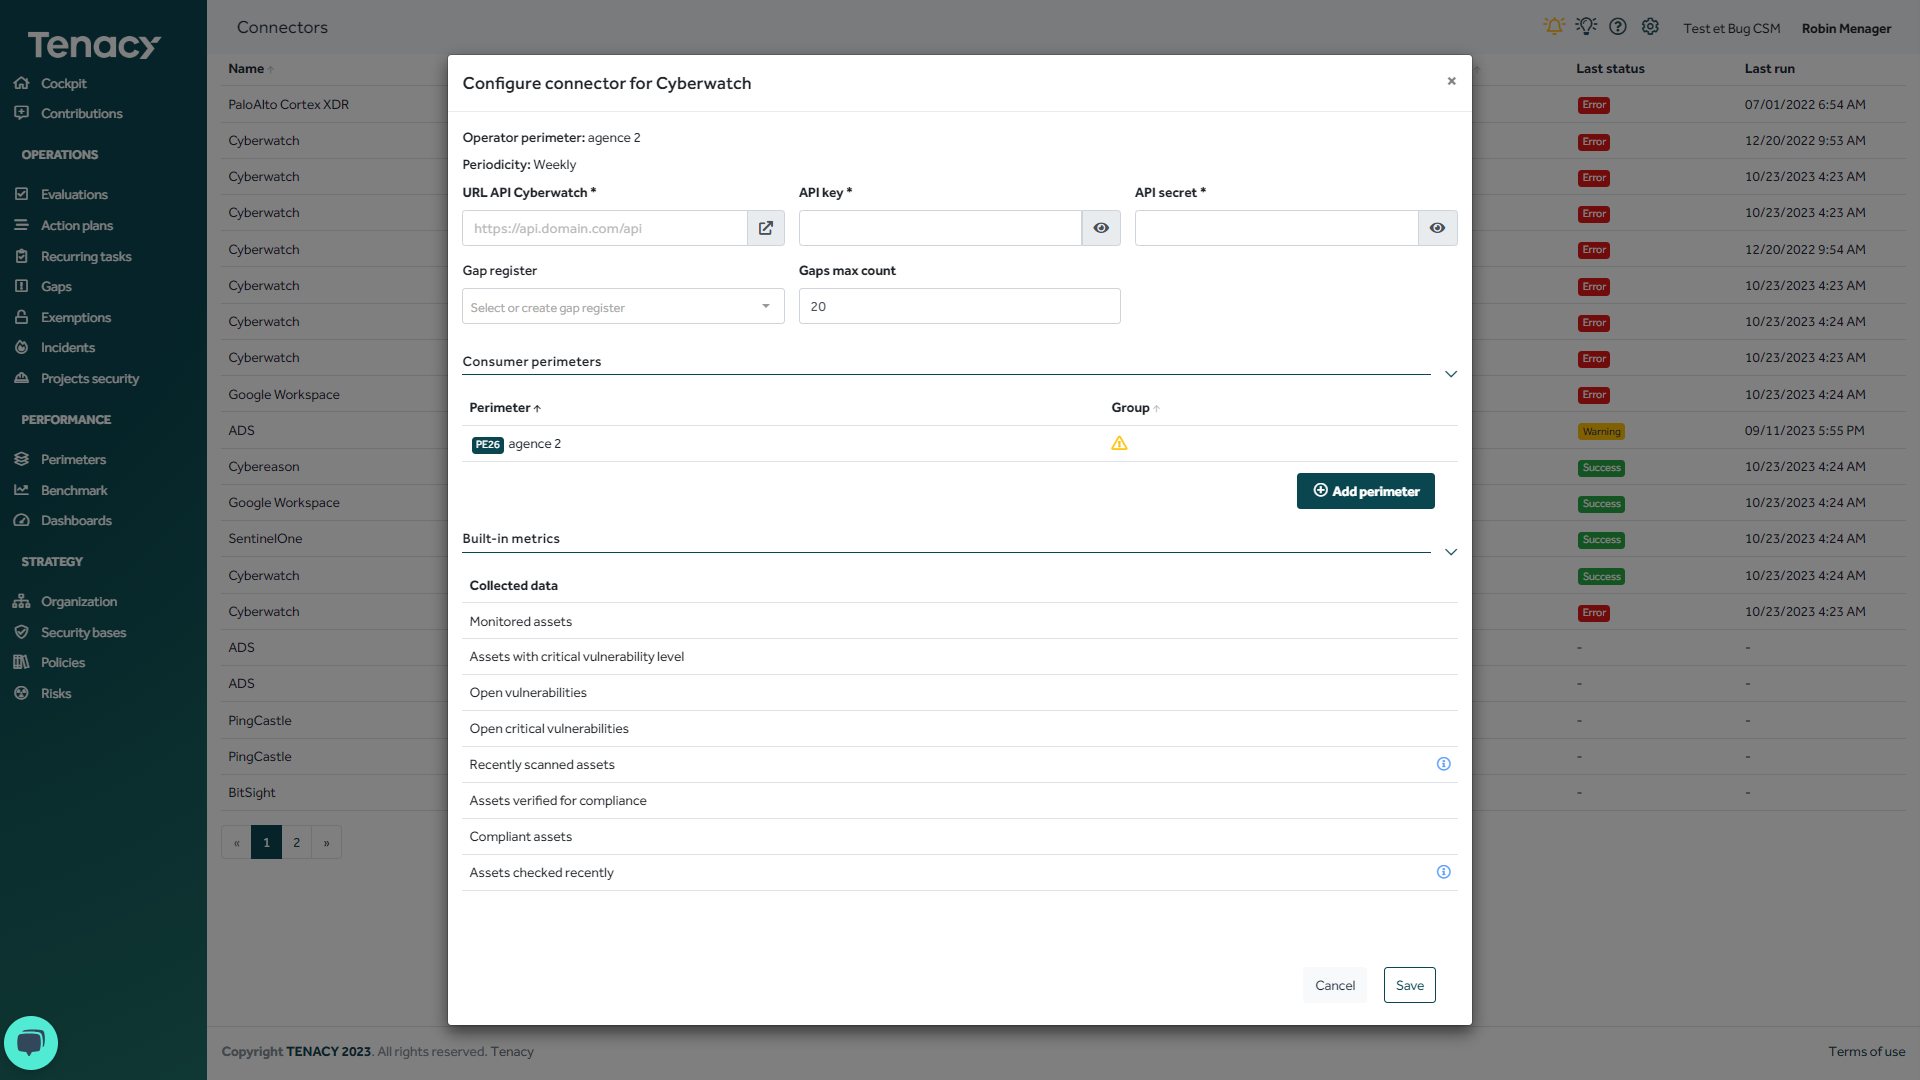
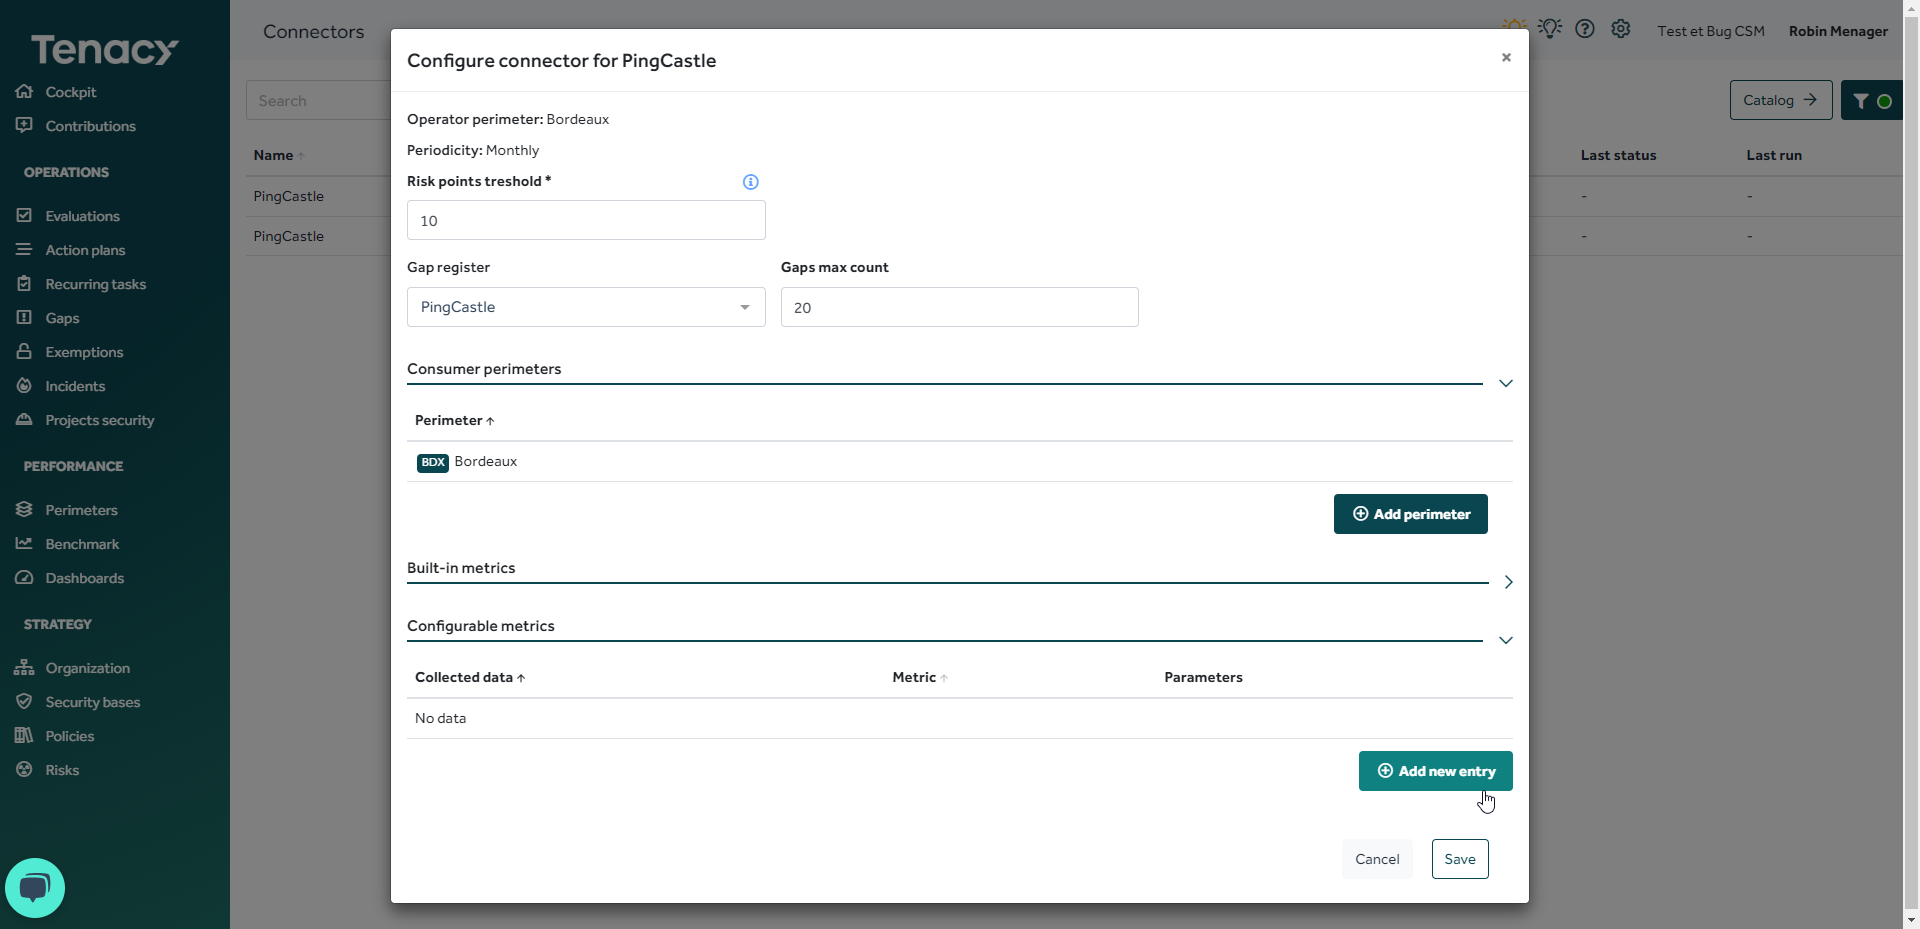
- The first step is to fill in any mandatory configuration fields.
- In the second step, you can add consumer perimeter by clicking on "add a perimeter."
- In the third step, you can identify the metrics that will be collected by the connector.
- In the fourth step, you can add configurable metrics. These metrics are not instantiated by default during the connector configuration. You will need to configure them here by clicking on "add an entry" if you want to collect them.
4. Instantiate a connector with modules
In some cases, a connector may offer you different modules.
For example, the Qualys connector provides tools for vulnerability management, endpoint security, web application analysis, malware detection, and compliance controls.
These various tools take the form of modules within Tenacy, which can be activated or deactivated by a pilot.
Each module is attached to a different measure.

5. Run a connector
💡For connectors operating via API, it is not necessary to manually run the connector. Once the configuration is complete, the connector will start retrieving data. However, you can still check the "jobs" for added security measures.
From the catalog, hover over the desired connector and click on "manage."
You can also go through the ⚙️gear icon > connectors.
To execute a connector, click on the corresponding line and then on the "run now" button.
Here you will find all the connectors instantiated in your environment.
You can edit the configuration of your connectors if necessary.
🚨 Once a connector is instantiated, it is no longer possible to change its frequency or operator perimeter.
🔎 Deleting a connector does not automatically result in the deletion of associated objects instantiated with it (metrics, recurring tasks, indicators, gaps, etc.).
You willl be asked to choose if you want to delete them with the connector or keep them.
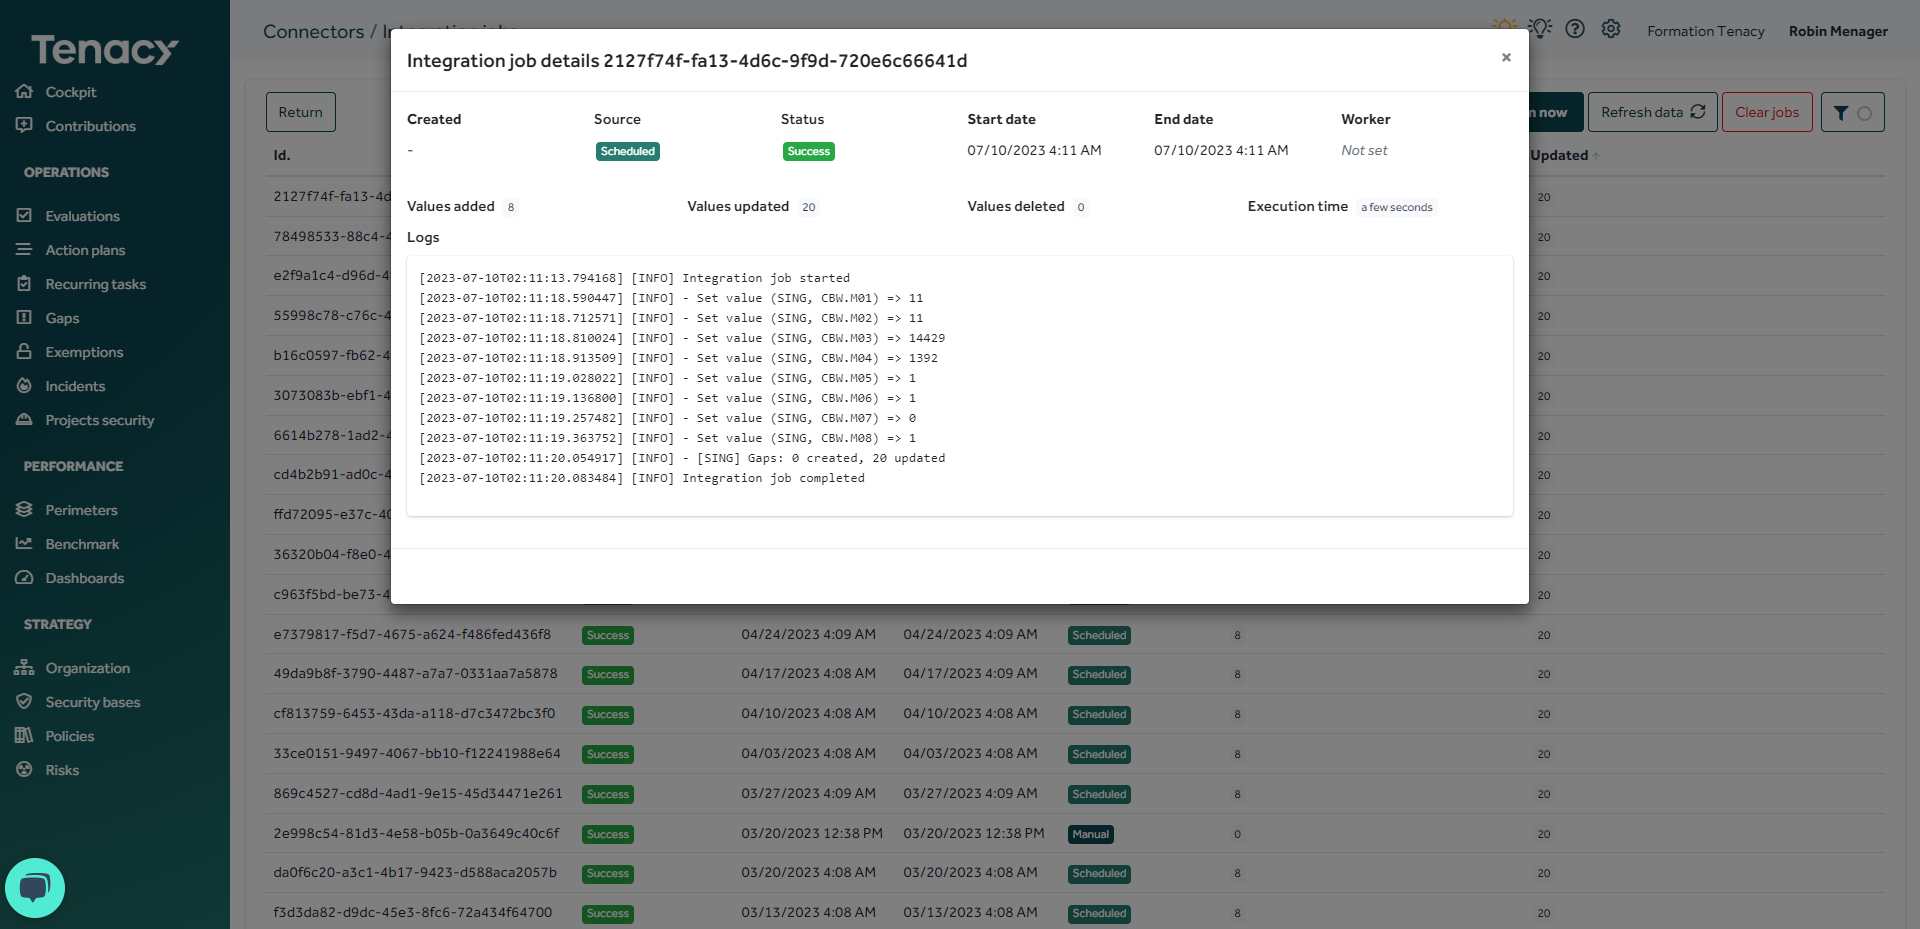
Once the connector has been executed, you can view the details of the "jobs" by clicking on the corresponding line.
Example of metrics and discrepancies reported by Cyberwatch.
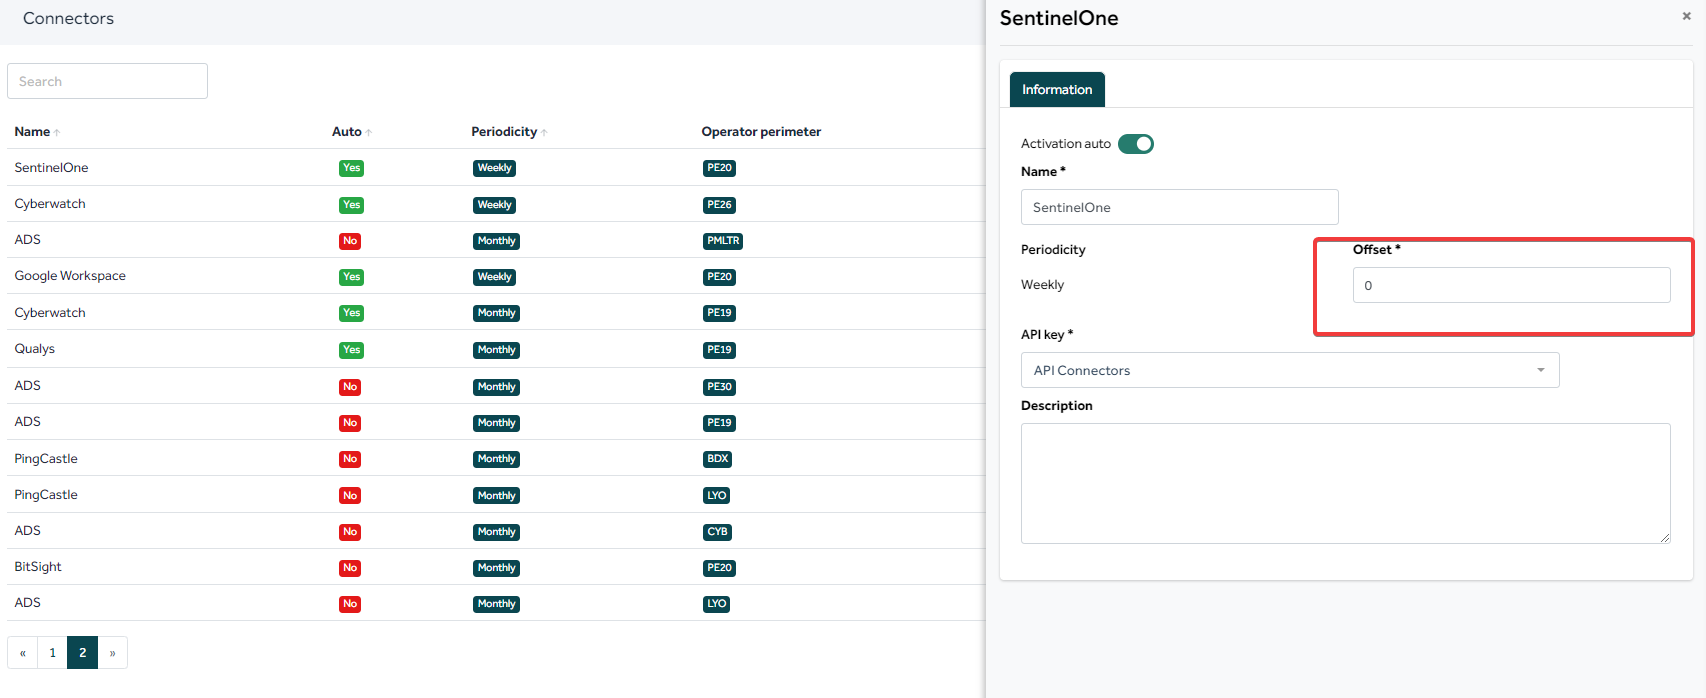
💡By default the values go up as follows:
- Weekly frequency: connector will be run every Monday (1st day of the week)
- Monthly frequency: connector will be run on the 1st of the month
- Quarterly, half-yearly and annual periods: connector will be run on the 1st of the 1st month of the period.
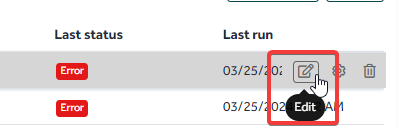
You can adjust the connector execution day by clicking the "Edit" icon > "Offset" (in days).
6. Where can I find the metrics reported by a connector?
To access the metrics reported by a connector, go to the "![]() Dashboard" and select the "Metrics" tab.
Dashboard" and select the "Metrics" tab.
Check the "show auto" box to view metrics reported by connectors.
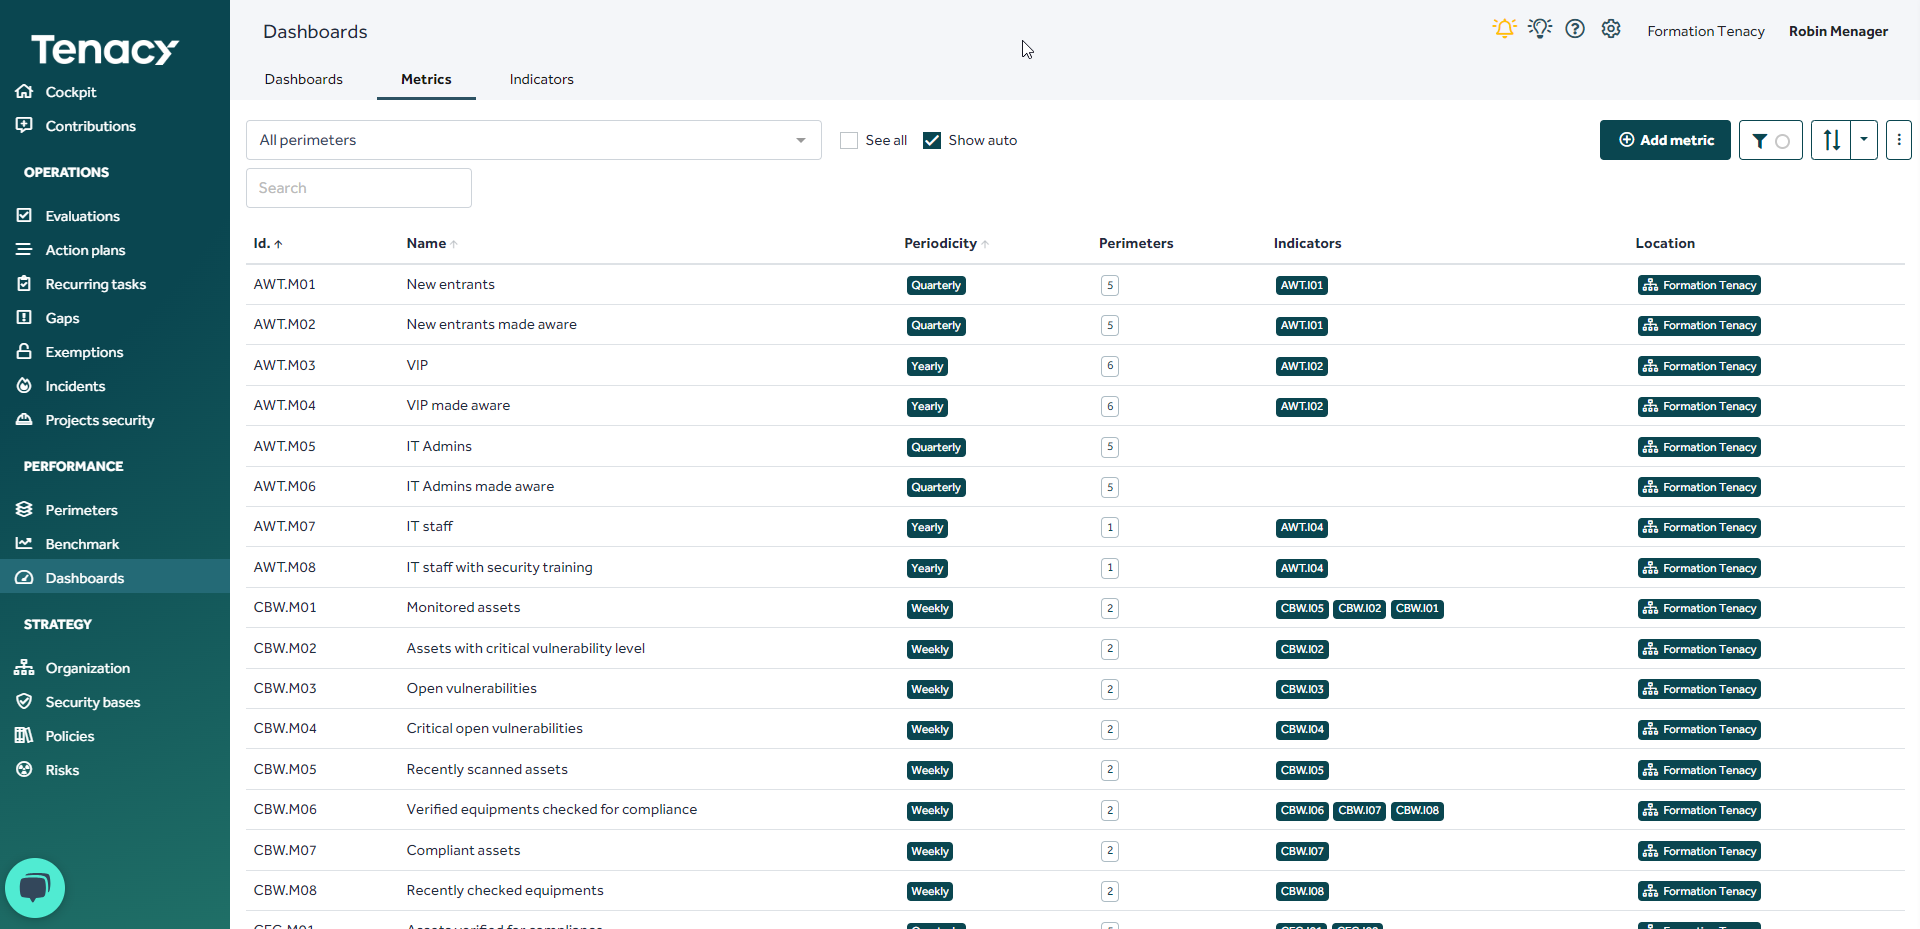
The IDs of the metrics include the acronym of the connector:
Cyberwatch = metrics starting by CBW
PingCastle = metrics starting by PGC
Etc.
💡Feel free to filter by operator perimeter if needed.
In addition to the metrics reported by the connector, Tenacy automatically creates performance and activity indicators powered by these metrics.
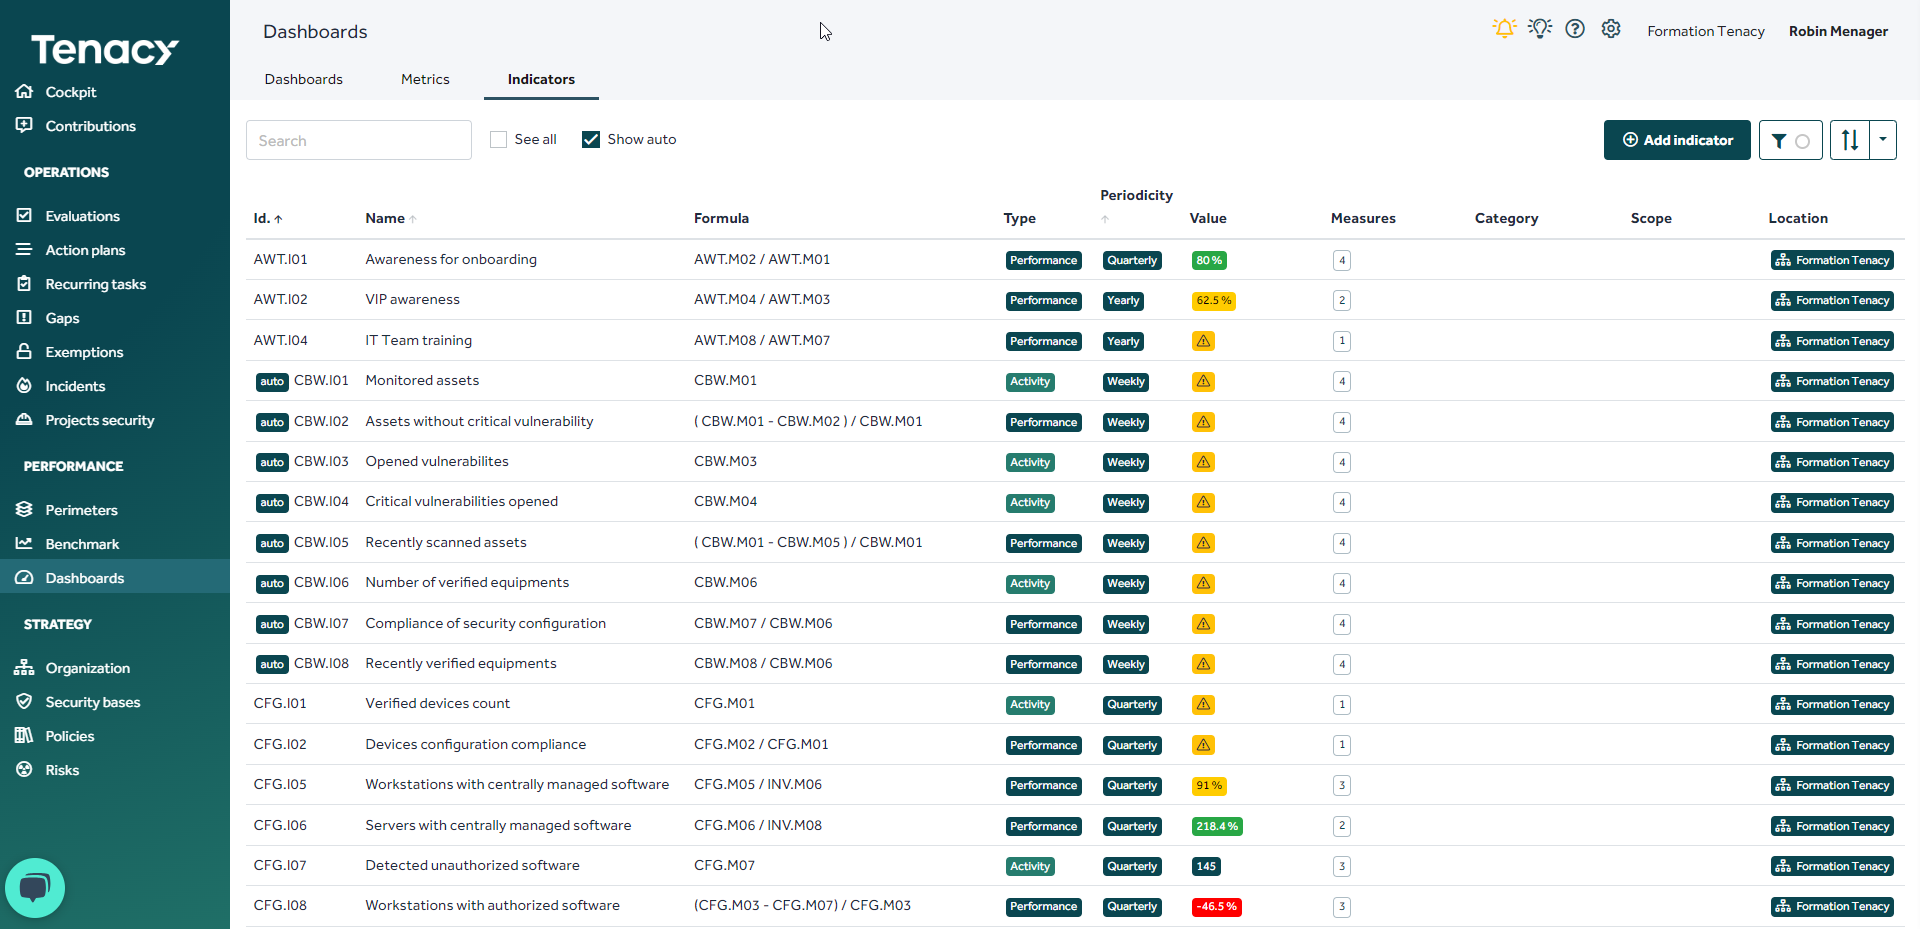
Example with the CyberWatch indicators
The indicators will be automatically linked to the operated measures during the instantiation of the connector.
💡Refer to step "2. What data can a connector retrieve?" if needed.
If necessary, you can remove the link between indicators from a connector and the measure by editing it from your security bases
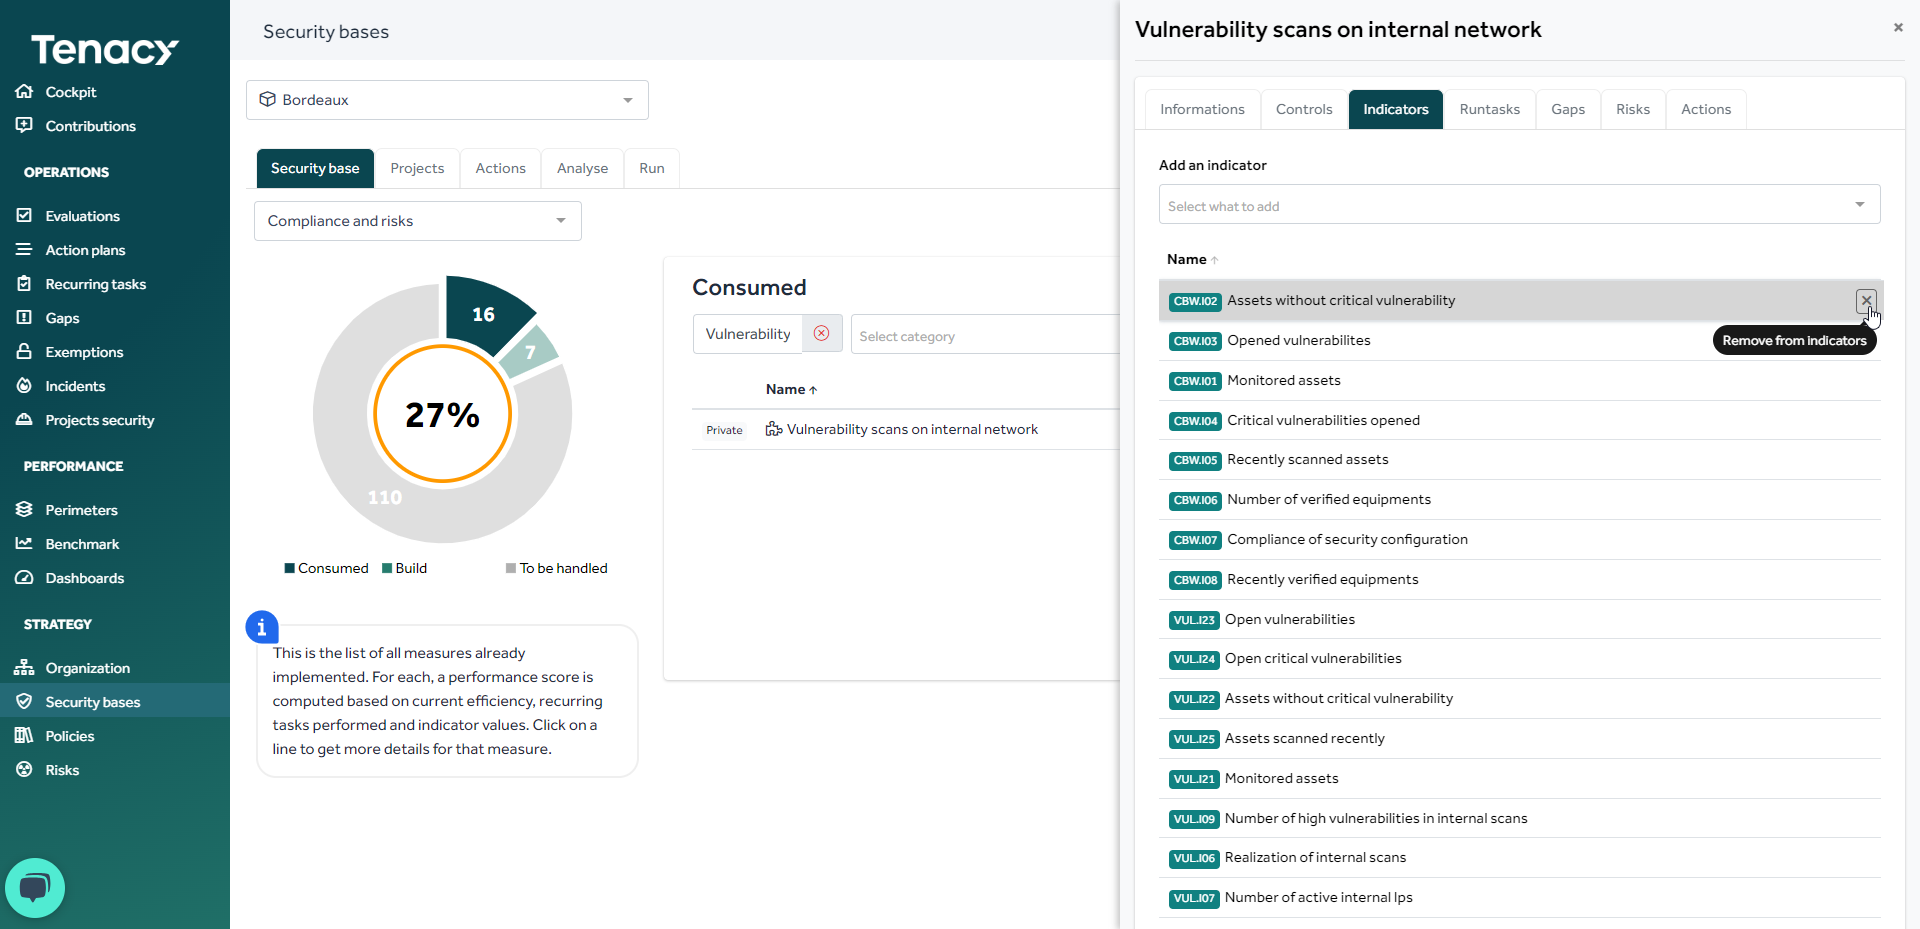
As a reminder, the performance indicators attached to your measure contribute to the calculation of the operational performance score.
How is the performance of my measure calculated?
7. Optional - Configurable metrics
For some indicators, it is possible to configure the collection of "configurable metrics".
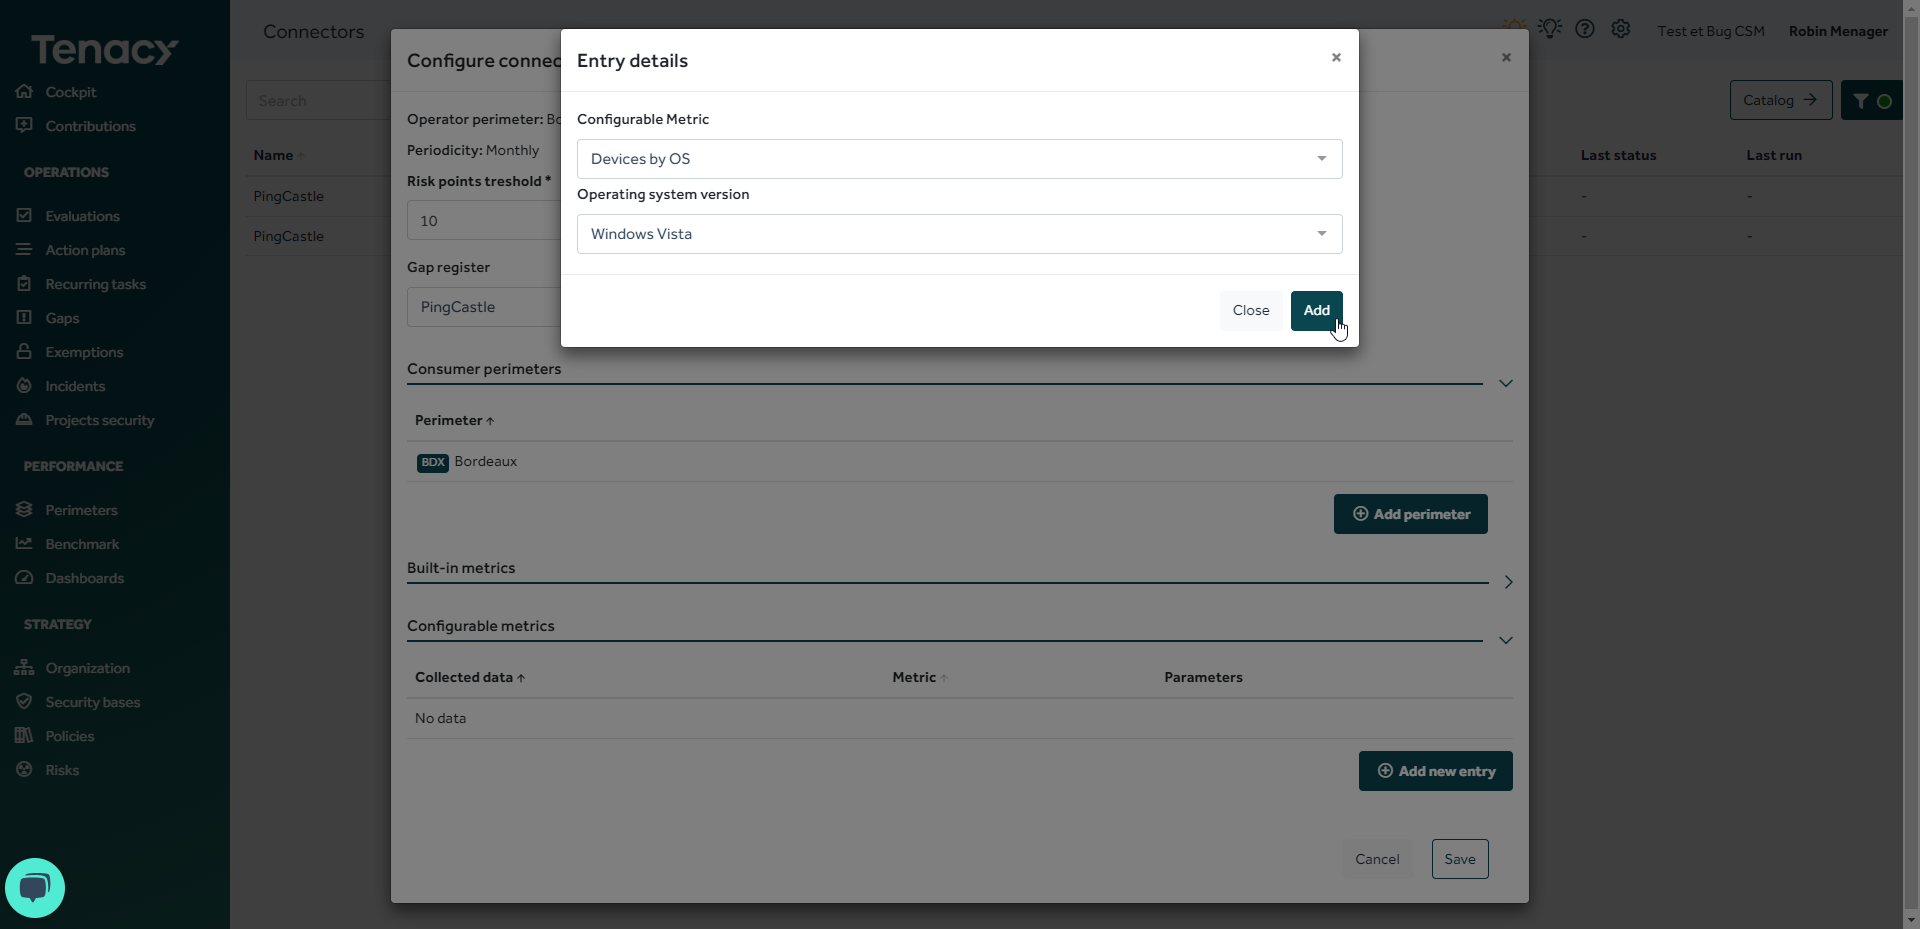
🔎 Please note that for configurable metrics, you will need to manually create an indicator based on them in order to use the indicators in a dashboard or link your indicator to a measure.
Finally, don't hesitate to use these indicators within a dashboard to create reporting blocks 📊.
To go further: Dashboards and Sharing Dashboards