All the steps to create your metrics and indicators and represent them in your dashboards.
Summary
Step 1 : Create your metric(s)
1. Creation of the metric in the catalog "Template"
1.1. The elements of creation for your metric
1.2. Operate the metric to track it
1.3. Assign your metric
2. Creation of the metric "in run/ out of template"
2.1. The elements of creation for your metric
2.2. Assignment and Delegations
Step 2 : Create your indicators
1. Creation of the indicator in the "template" catalog
1.1. The elements of creation for your indicator
1.3. Reattach the indicator to one or more measures
2. Creation of the indicator "in run/ out of template"
2.1. The elements of creation for your indicator
2.2. Reattach the indicator to one or more measures
Step 3 : Representation in a dashboard
1. Representation of your indicator
🔢 Step 1 : Create your metric(s)
There are 2 solutions to create your metric:
- In your catalog to have the template : Allow your drivers to operate within their perimeter(s).
- Run/out of template: To operate it directly in your holding.
🚨 With this method if you delete your metric you will have to create it again from scratch.
1. Creation of the metric in the catalog "Template"
You can create your metrics in :
⚙️ Cranked wheel > Catalog > Metric tab > "Add metric" button or via Excel.
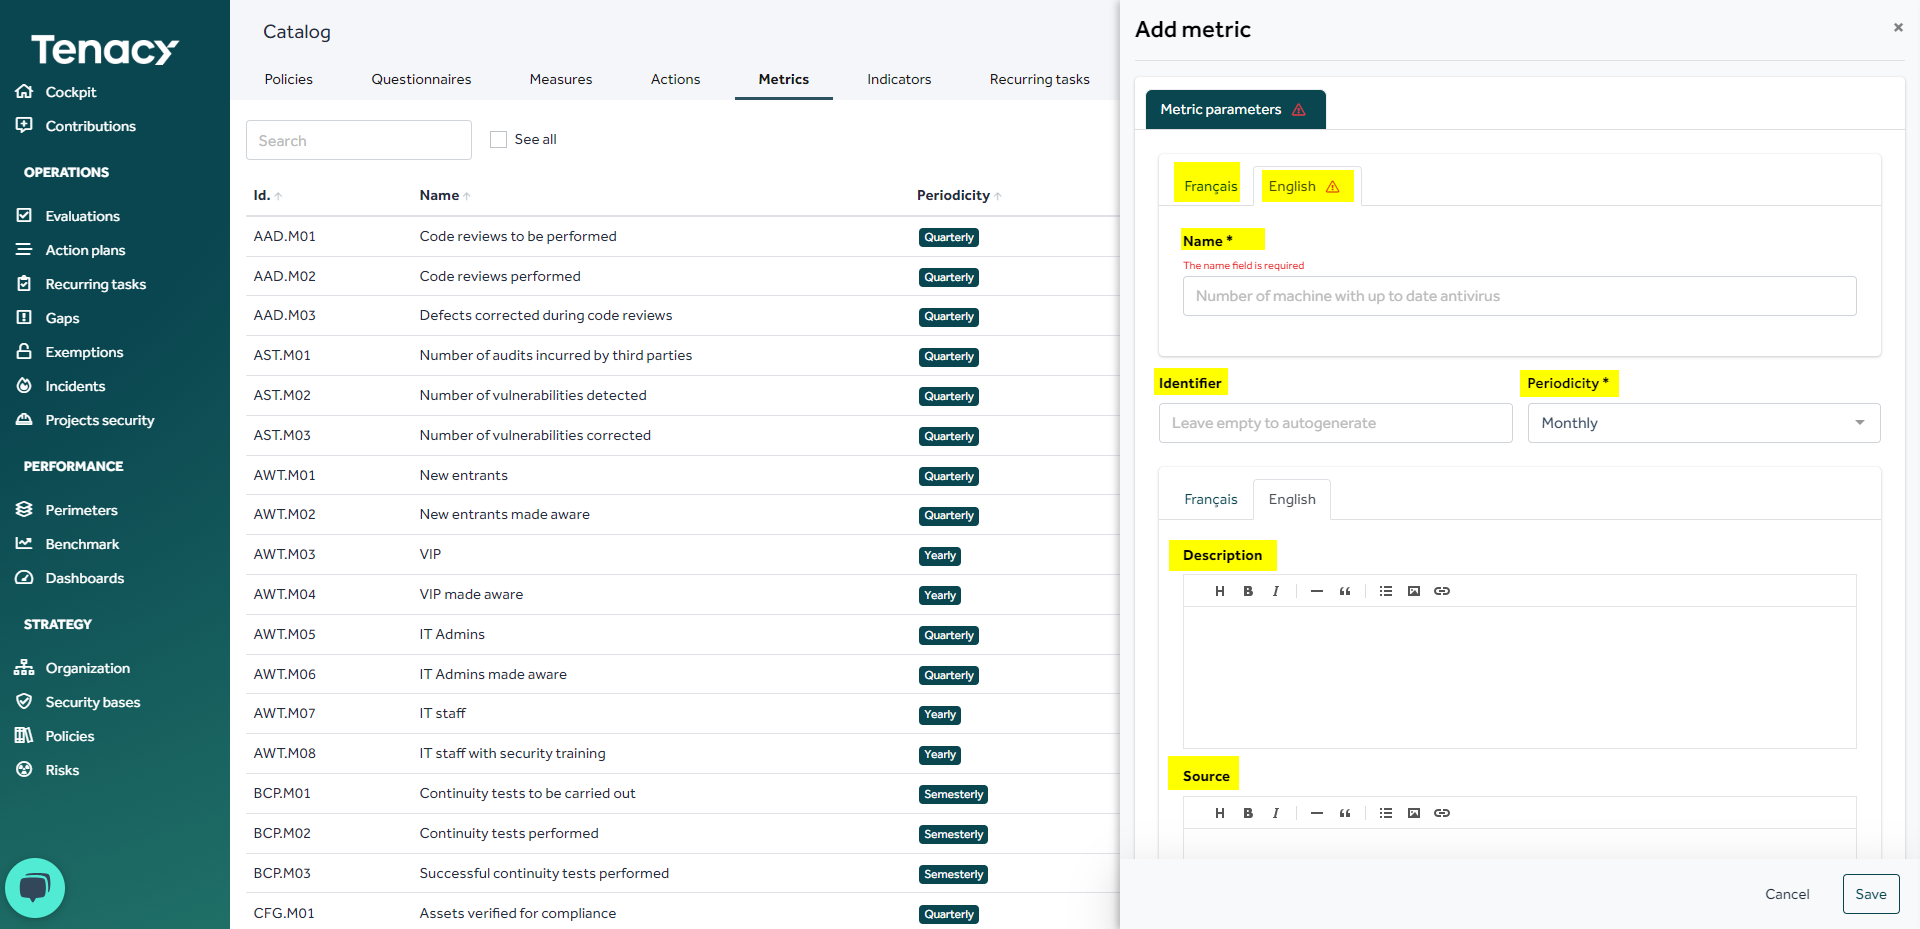
1.1. The elements of creation for your metric
- Name of your metric
- Identifier: Not required, if you leave blank the solution will automatically create an identifier.
- Periodicity: Period of collection of your metric (Ex: Monthly: I will collect/ fill in my metric every month.)
- Description and Source: You can fill in both English and French.
1.2. Operate the metric to track it
🔎 Operate: Make it applicable on one or more perimeters.
- Place your cursor on the metric and click on the wheel icon ⚙️.
- Select the perimeter or grouping and save.
1.3. Assign your metric
Go to Dashboard > Metrics tab > Search for your metric (Ex: Code reviews to be performed) > Click on the metric > Assignments and Delegations tab > Save.

🔎 In this example: my users from Bordeaux will collect metrics for Bordeaux, Lille and Lyon. The user "Global Support" from Paris will collect for Paris.
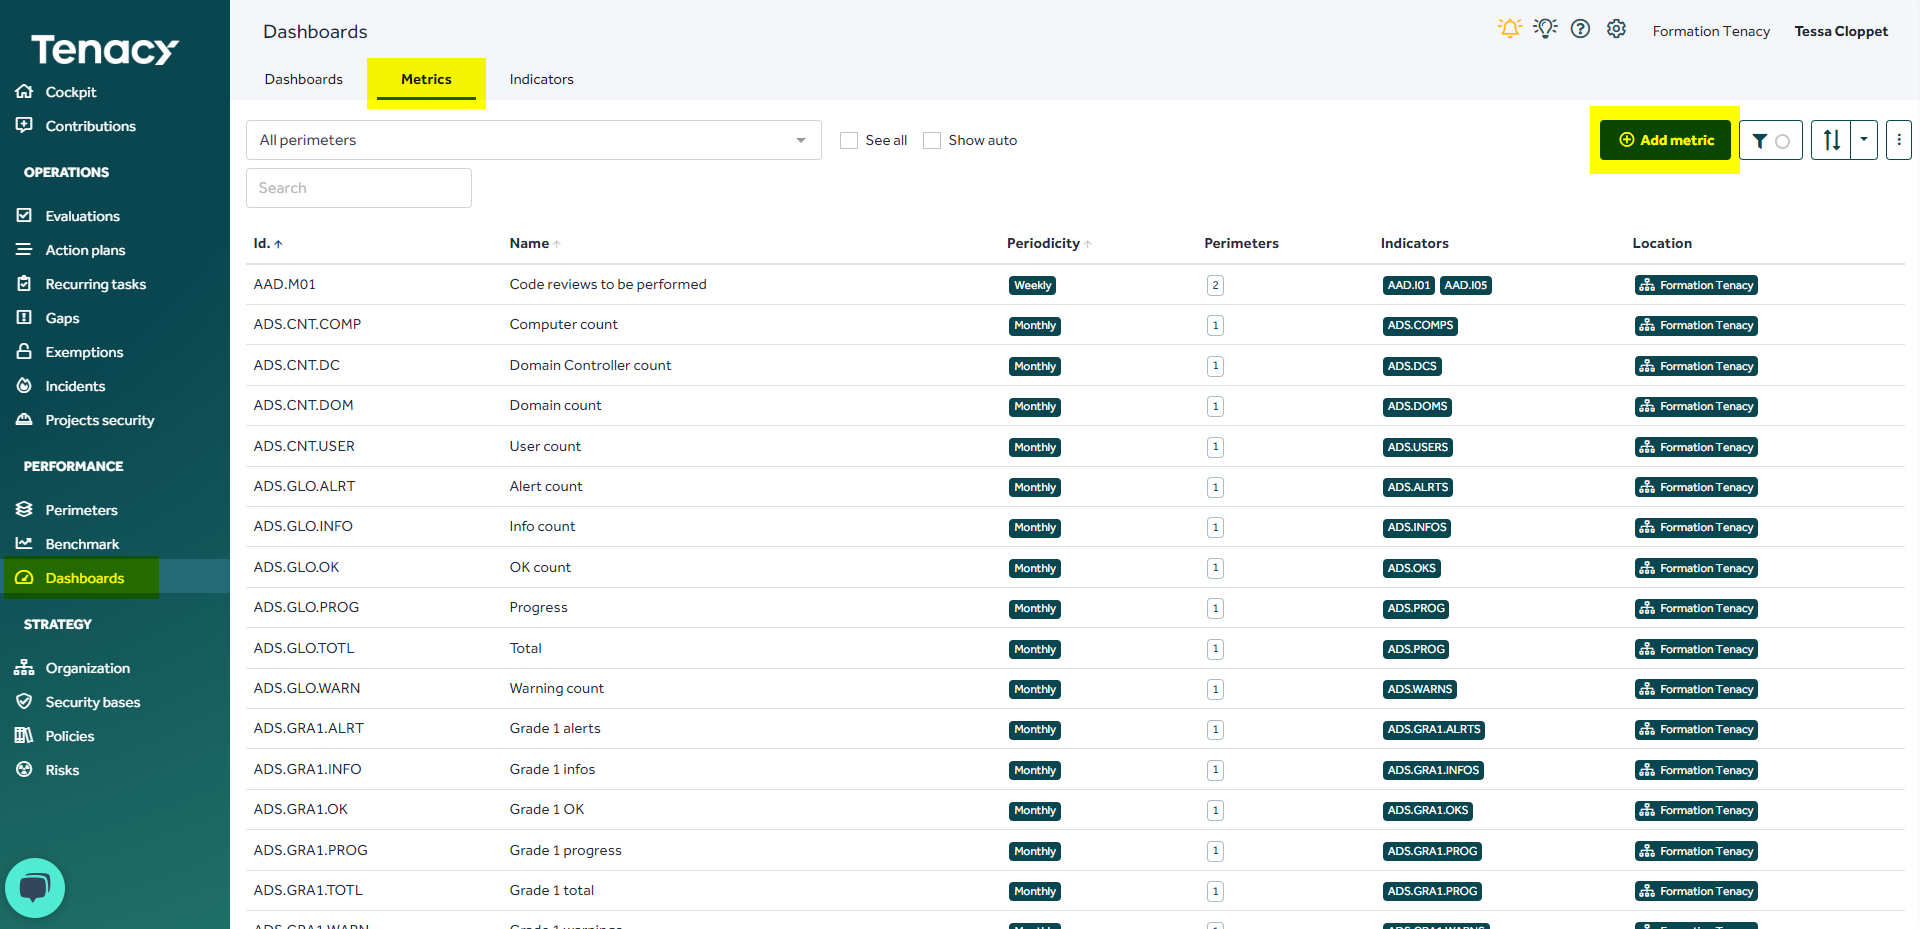
2. Creation of the metric "in run/ out of template"
You can create your metrics in the Dashboards > Metrics tab section > "Add metric" button.
2.1. The elements of creation for your metric
- Name of your metric
- Identifier: Not required, if you leave blank the solution will automatically create an identifier.
- Periodicity: Period of collection of your metric (Ex: Monthly: I will collect/ fill in my metric every month.)
- Associated grouping: The metric will be automatically associated with the perimeters created in the grouping and or root.
- Description and Source: You can fill in both English and French.
✔️ Save your metric.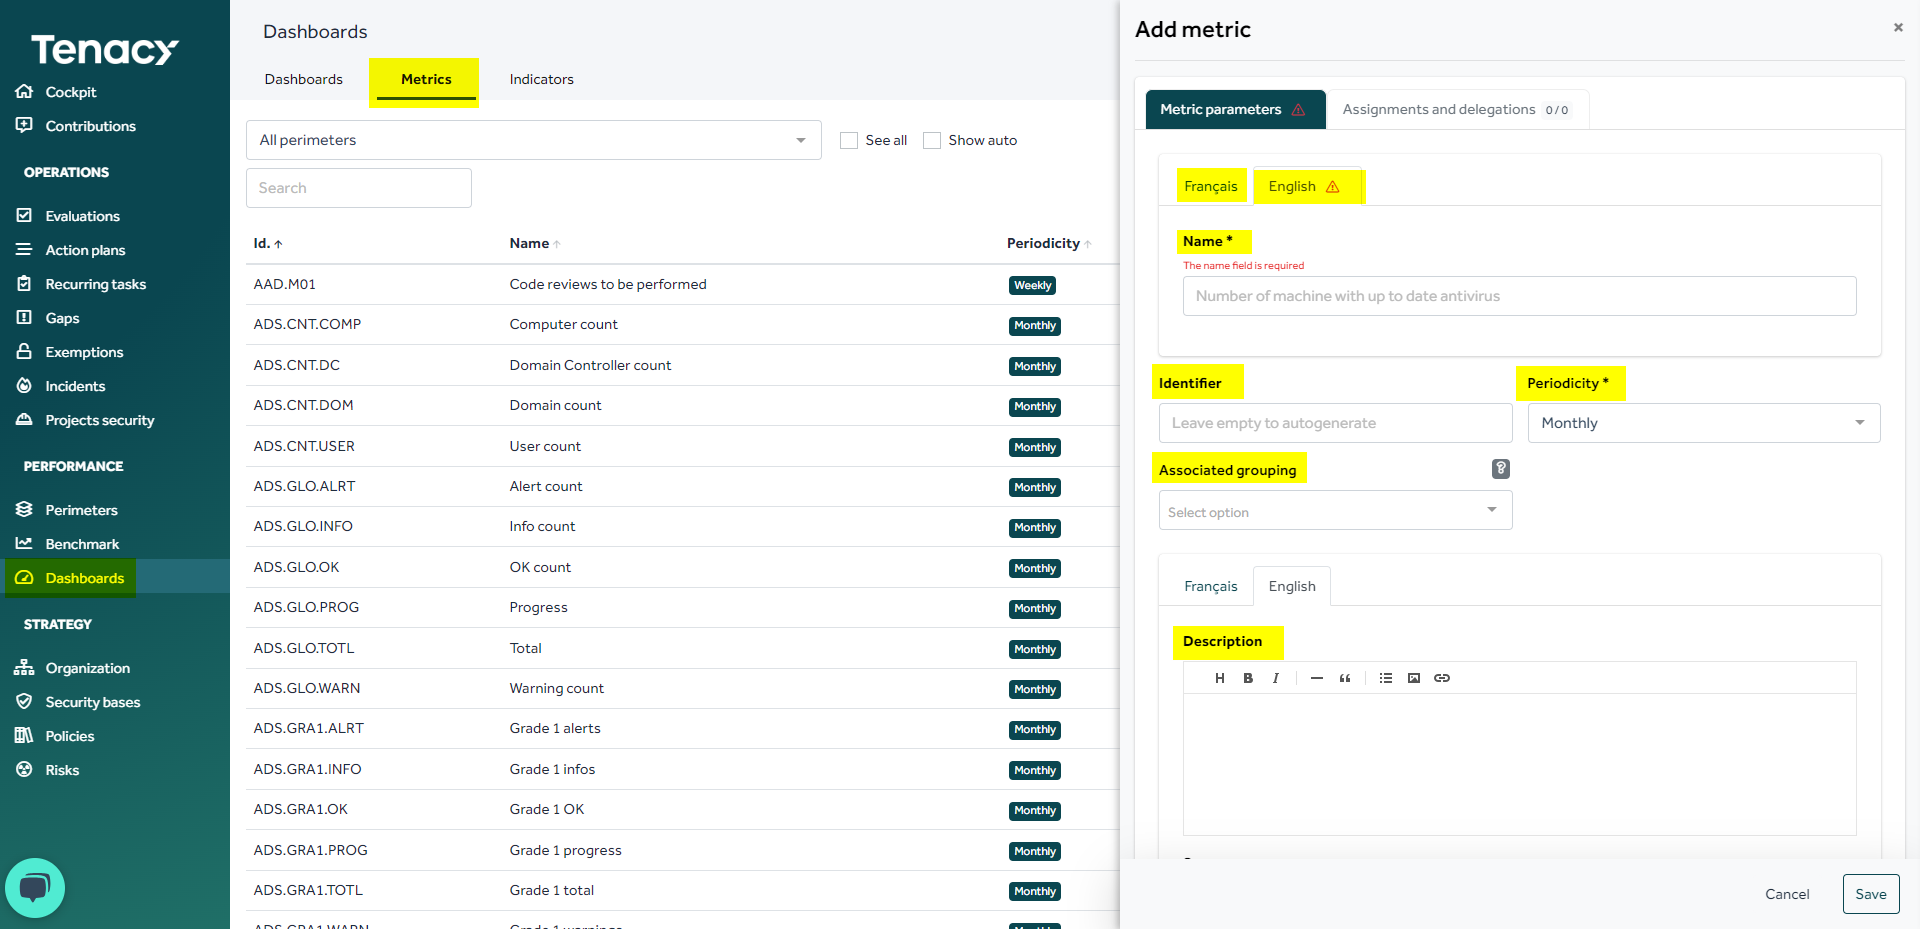
2.2. Assignment and Delegations
In this tab:
- Add your perimeter(s): if you haven’t filled any associated groupings before.
- Perimeter: The perimeter on which the metric is associated.
- Select your collector perimeter: The perimeter in charge of collecting the metric
- User/ group: The person or people in charge of entering the metric in the solution.
✔️ Save your metric.
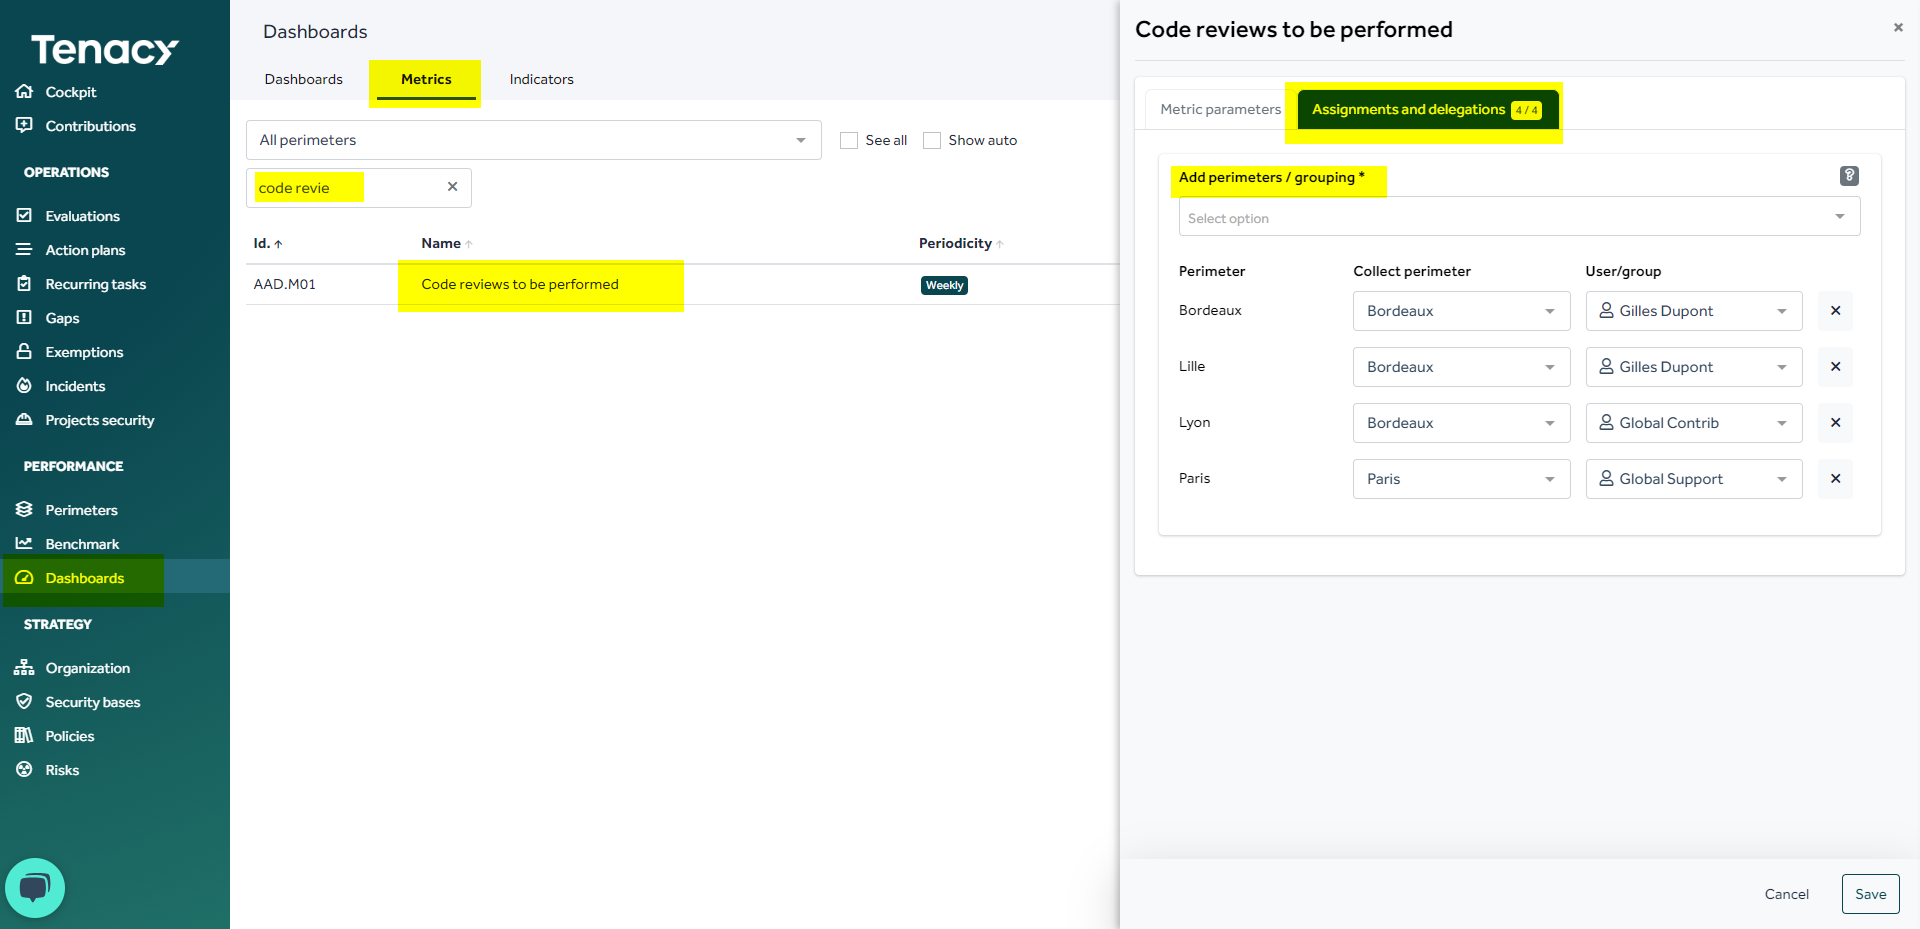
🔎 In this example: my users from Bordeaux will collect metrics for Bordeaux, Lille and Lyon. The user "Global Support" from Paris will collect for Paris.
💯Step 2: Create your indicators
As for metrics, you have 2 solutions to create your indicator:
- In your catalog to have the template: in order to have it in "Database" and leave the possibility to your drivers to operate within their perimeter(s).
- Run/out of template: To operate directly in your holding.
🚨 With this method if you delete your metric you will have to create it again from scratch.
1. Creation of the indicator in the "template" catalog
You can create your indicators in:
⚙️ Cranked wheel > Catalog > Indicators tab > "Add indicator" button or via Excel.
⚠️ If you do not create your indicator in template you will not be able to create your indicator.
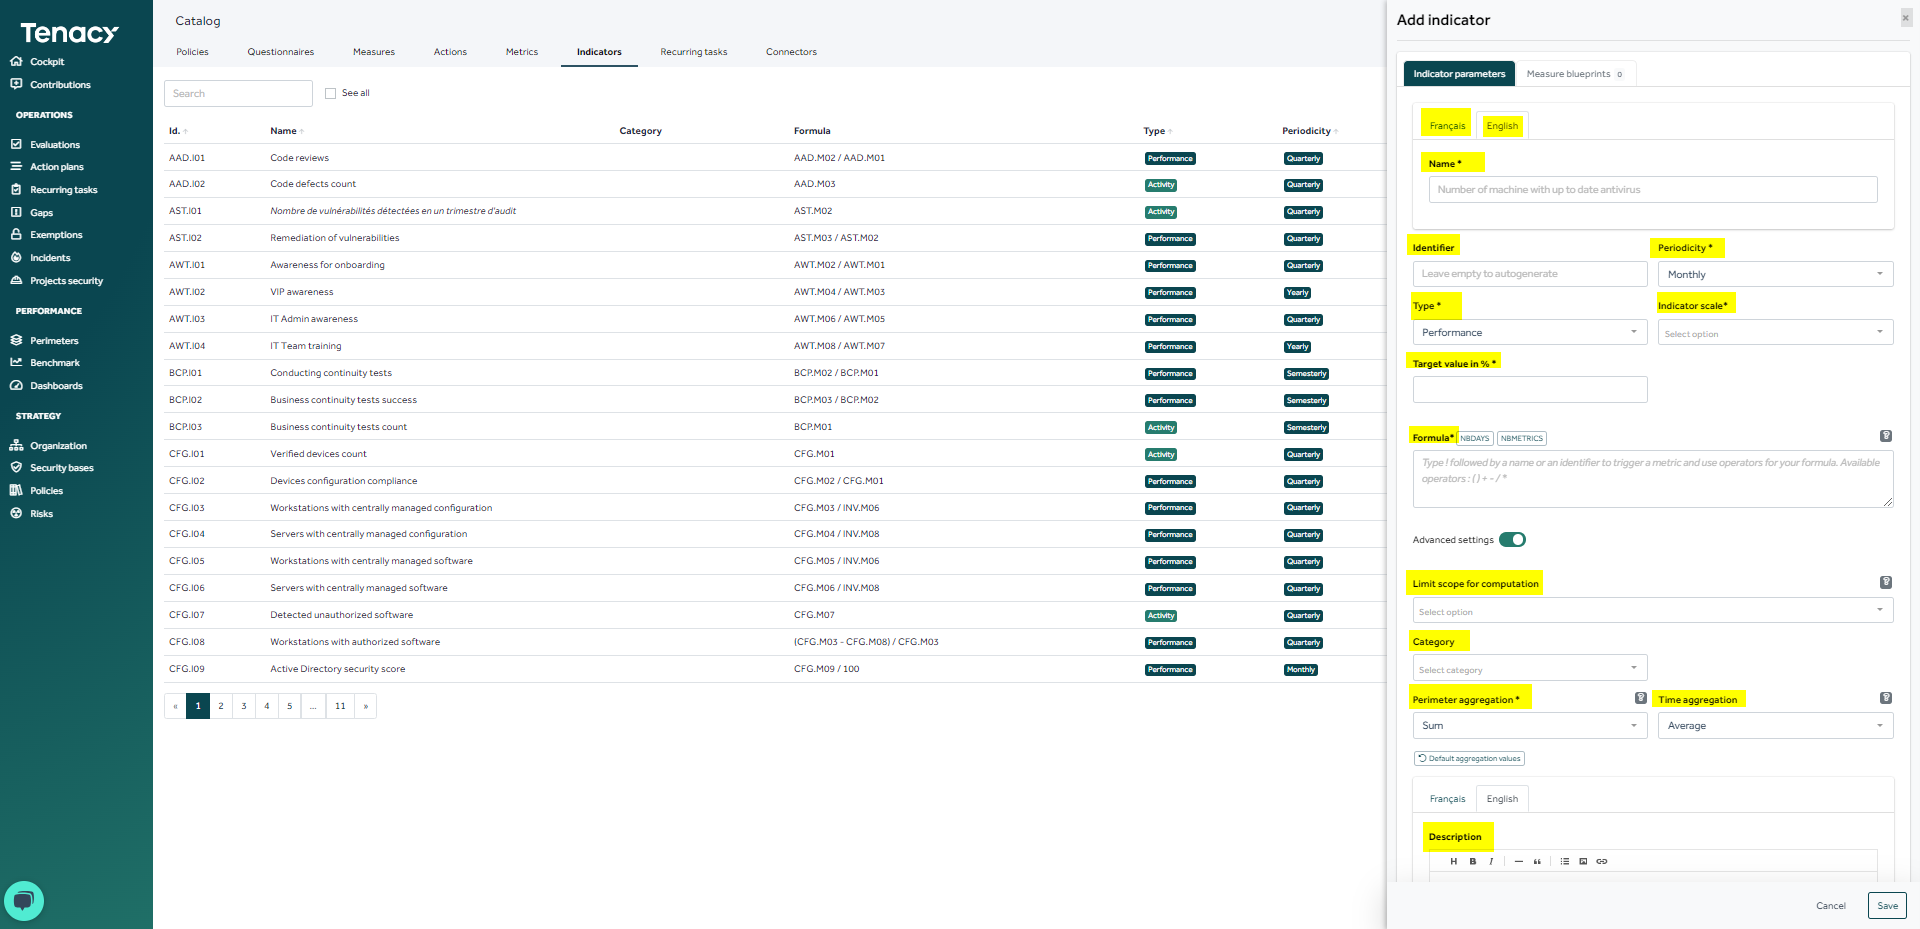
1.1. The elements of creation for your indicator
- Name of your indicator
- Identifier: Not required, if you leave blank the solution will create an identifier automatically.
- Periodicity: Period of collection of your indicator (Ex: Monthly: I will collect/ fill in my metric every month.)
⚠️ The periodicity must be the same or higher than your metrics.
- Indicator Scale: How would you like to represent your indicators.
💡 You find your indicator scales in the ⚙️Wheel > Scales > "Indicators" tab
-
Type: There are two types of indicator "activity" and "performance"
🔟 Activity indicator: Can be linked to a device but without impact on the performance calculation
📈 Performance indicator: Occur in the performance of a device. Must be increasing to be linked to it (The goal is to be closest to 100%). -
Target value in %: Meets your target. From what percentage I think my indicator meets my target.
Formula: Create the formula of your indicator with the IDs of your metrics.
💡 Use " !" to display suggestions and the name of your metrics to avoid errors.
Advanced Settings:
-
Limit scope for calculation: No perimeter outside the selected perimeter/grouping will be used to calculate this indicator.
-
Aggregation of perimeters: When the indicator is calculated over multiple perimeters, the values of one metric for each perimeter will be aggregated as follows.
-
Temporal Aggregation: For a lower frequency metric, choose how the values are aggregated over time. If not specified, the activity indicators will use the sum, and the performance indicators the mean.
-
Category: Native to the solution to rank your indicators.
Description: you can fill the field in French and English.
1.2. Operate your indicator
Cursor on your indicator > ⚙️"Operate the indicator" > Select its perimeter or group > Save
1.3. Reattach the indicator to one or more measures
🟢 Increasing performance indicator: Strongly recommended
🟠 Activity indicator: Possible but not mandatory
🔴 Decreasing performance indicator: Do not reattach.
1. Security base > Choose your perimeter > "Run" tab > Modify measure
2. "Indicator" tab > Existing indicator > Existing associations > Add
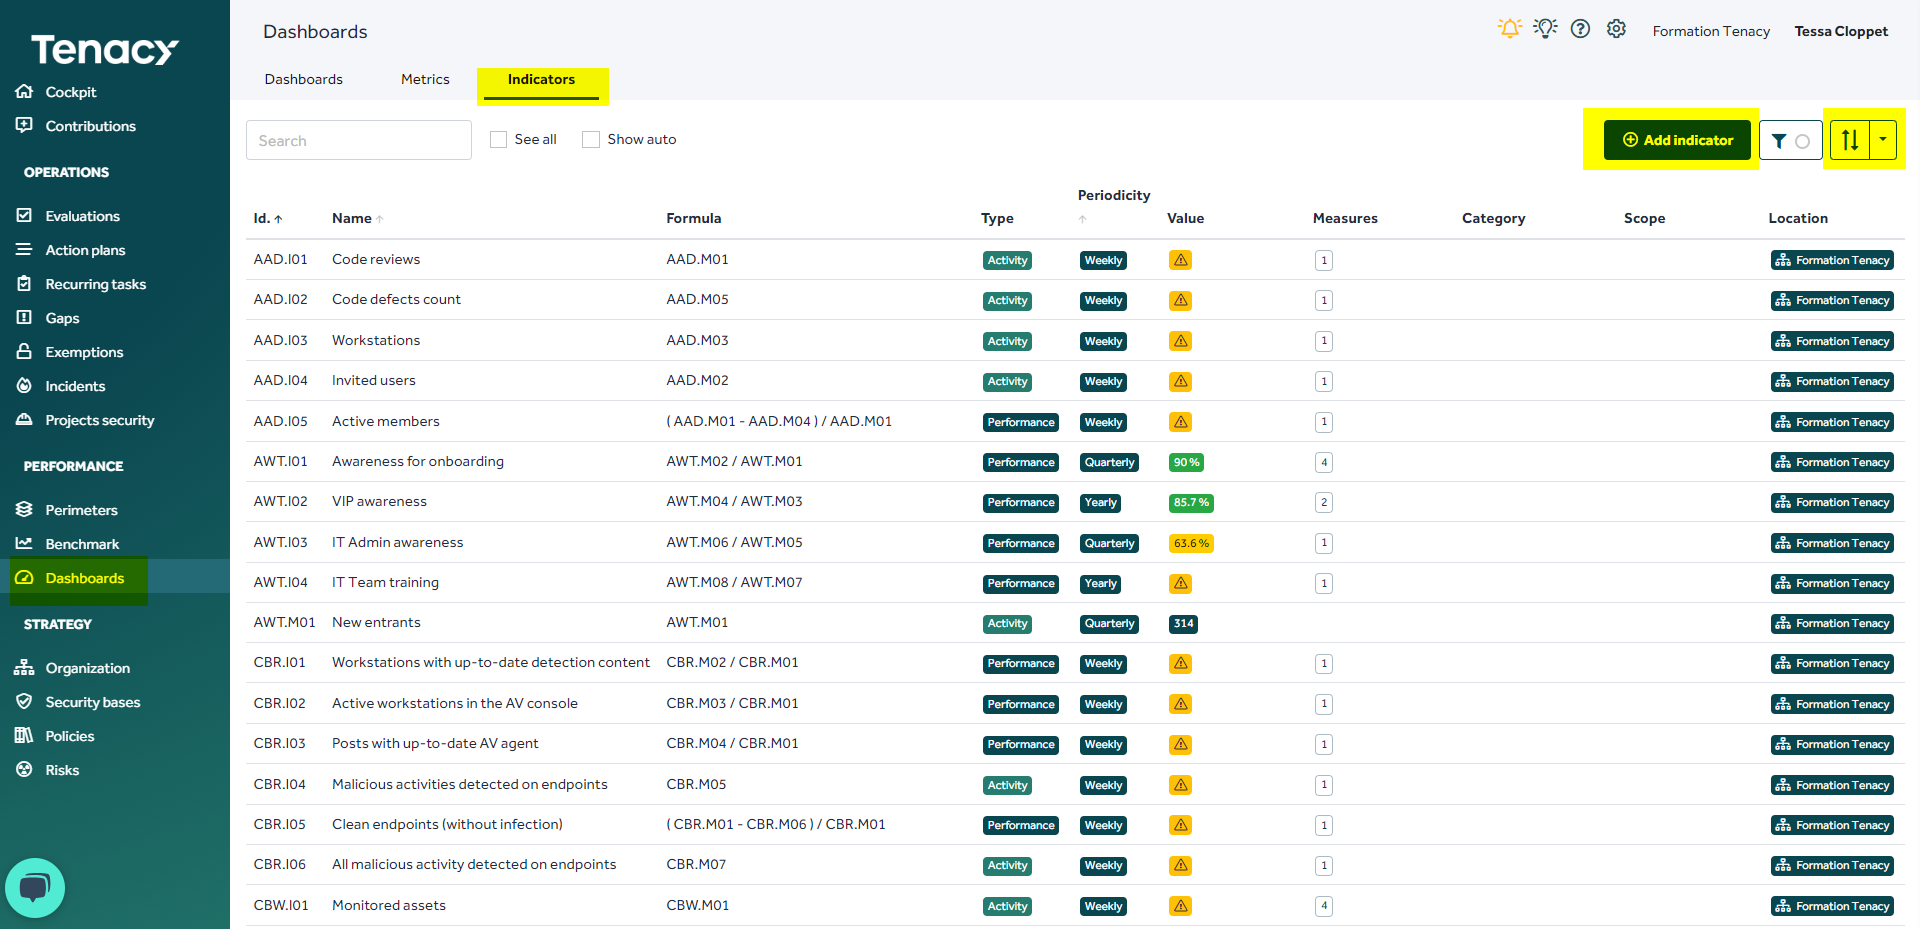
2. Creation of the indicator "in run/ out of template"
You can create your indicator in the section Dashboards > Indicators tab > "Add indicator" button or via Excel.
2.1 The elements of creation for your indicator
- Name of your indicator
- Identifier: Not required, if you leave blank the solution will create an identifier automatically.
- Periodicity: Period of collection of your indicator (Ex: Monthly: I will collect/ fill in my metric every month.)
⚠️ The periodicity must be the same or higher than your metrics.
- Indicator Scale: How would you like to represent your indicators.
💡 You find your indicator scales in the ⚙️Wheel > Scales > "Indicators" tab
-
Type: There are two types of indicator "activity" and "performance"
🔟 Activity indicator: Can be linked to a device but without impact on the performance calculation
📈 Performance indicator: Occur in the performance of a device. Must be increasing to be linked to it (The goal is to be closest to 100%). -
Target value in %: Meets your target. From what percentage I think my indicator meets my target.
- Formula: Create the formula of your indicator with the IDs of your metrics.
💡 Use " !" to display suggestions and the name of your metrics to avoid errors.
- Advanced Settings:
-
Limit scope for calculation: No perimeter outside the selected perimeter/grouping will be used to calculate this indicator.
-
Aggregation of perimeters: When the indicator is calculated over multiple perimeters, the values of one metric for each perimeter will be aggregated as follows.
-
Temporal Aggregation: For a lower frequency metric, choose how the values are aggregated over time. If not specified, the activity indicators will use the sum, and the performance indicators the mean.
-
Category: Native to the solution to rank your indicators.
- Description: you can fill the field in French and English.
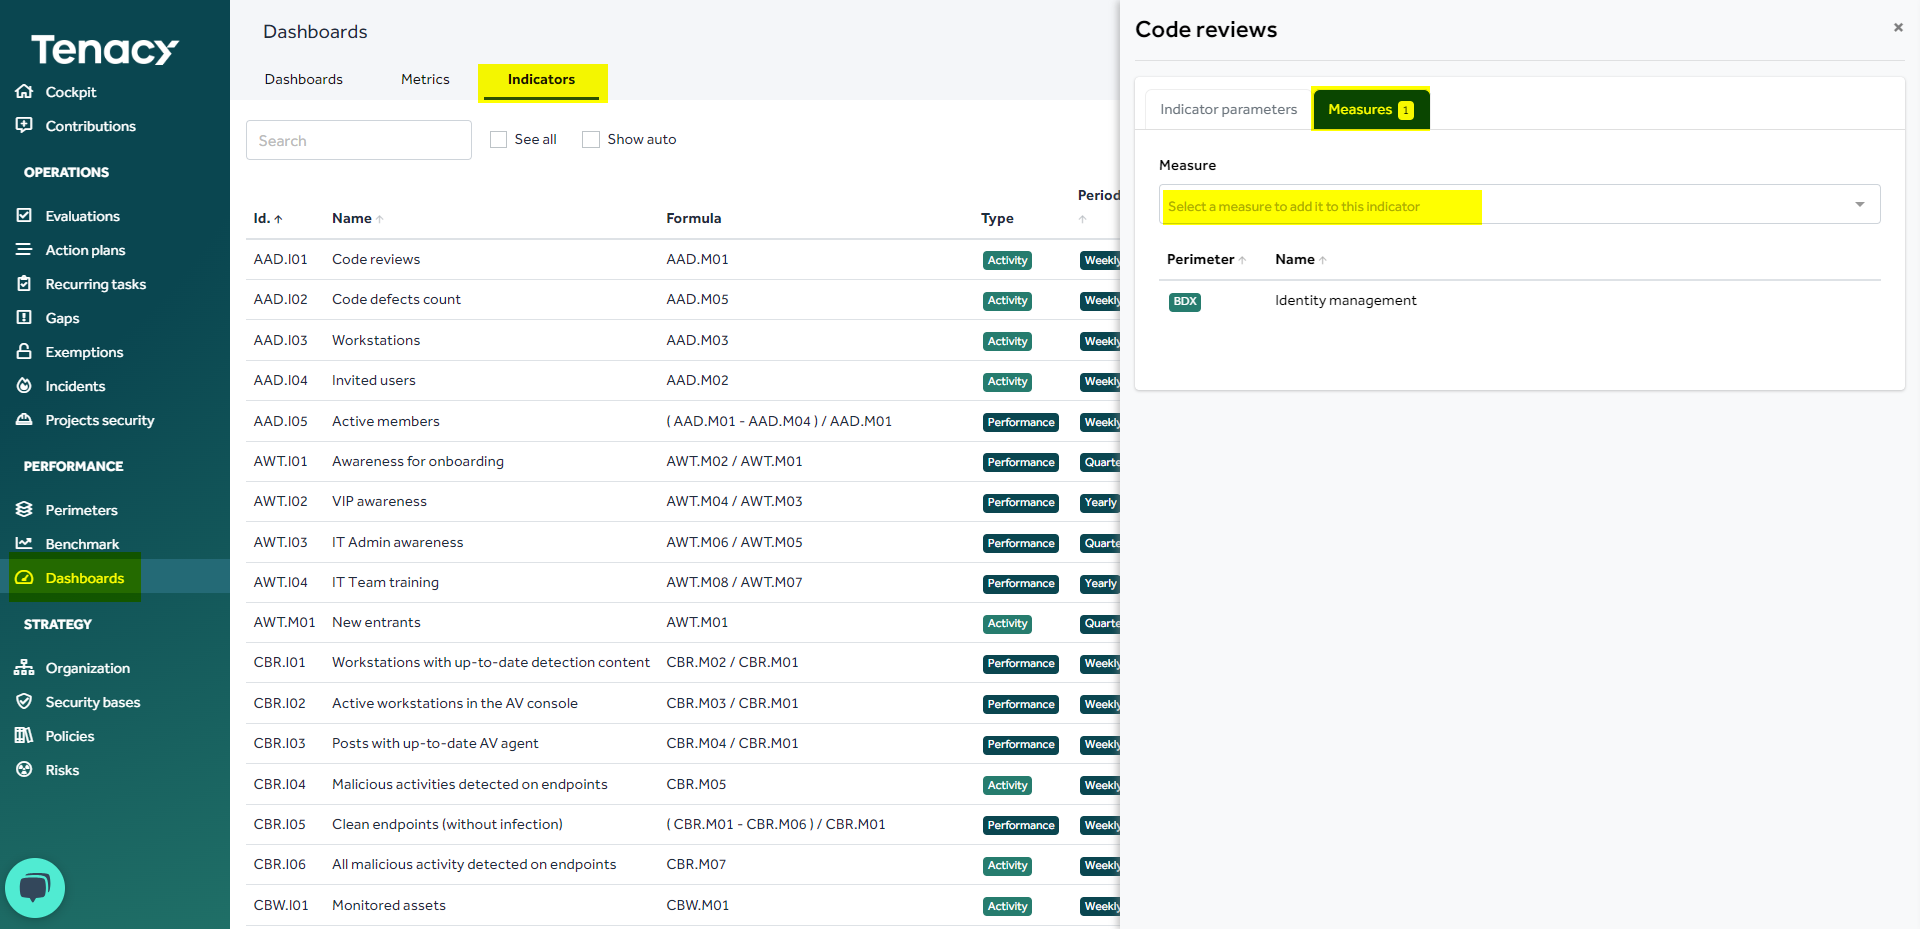
2.2. Reattach the indicator to one or more measures
🟢 Increasing performance indicator: Strongly recommended
🟠 Activity indicator: Possible but not mandatory
🔴 Decreasing performance indicator: Do not reattach.
Dashboards > "Indicators" tab > Click on the indicator > "Measures" tab
📊 Step 3: Representation in a dashboard
1. Representation of your indicator
1. Dashboards > "Dashboards" tab > Add a dashboard or select a dashboard.
2. Adjustable wrench > Add a bloc > Operational indicators > Type: You are free to choose what you want to represent. > Select your indicator > Next > Display: select your representation.
💡 You can create 2 blocks with a different representation by reproducing the manipulation.